
Conversion rate optimisation, also known as CRO, aims to increase the conversion rate of your website through data-driven research, strategy and implementation, which in turn will help improve your revenue and profit.
Your CRO objectives and overarching strategy will vary depending on your business type. For example, eCommerce sites might want to increase orders and average order value, whereas SaaS (Software as a Service) businesses might want to increase their leads via form-fills and phone call enquiries. However, the process behind your CRO efforts will remain the same.
A typical CRO strategy will consist of ongoing optimisations of your website through continuous A/B testing and user research. To give your strategy the best chances of succeeding, it should be based on extensive research and data, as opposed to guesswork and opinion – which we’ll touch on more later in this guide.
Why should I include CRO in my marketing strategy?
Conversion rate optimisation compliments any marketing activities you may already be engaged in. If you’re spending budget on traffic acquisition through activities such as SEO or PPC, you may not get the best ROI back. By investing in CRO services and optimising your website in tandem with existing marketing activities, you can make your existing traffic convert at a higher rate by securing conversions more effectively and earlier – in a user’s journey.
A big attraction of CRO is that it delivers results without additional marketing spending beyond the time invested. You don’t need an advertising budget, and you don’t need to fork out bespoke media creation for it to be successful.
Finally, by gathering data and insights from heatmaps, scrollmaps and test results, you can’t help but learn more about your audience and how they engage with your business. More detailed knowledge about what your audience is interested in and how they behave on your website is invaluable when planning future advertising strategies, sales techniques and marketing campaigns.
Practical tips for turning users into customers
Set up accurate tracking
Before doing anything else, we recommend checking that your analytics software is set up correctly, so you’re confident that your decisions will be based on high-quality data.
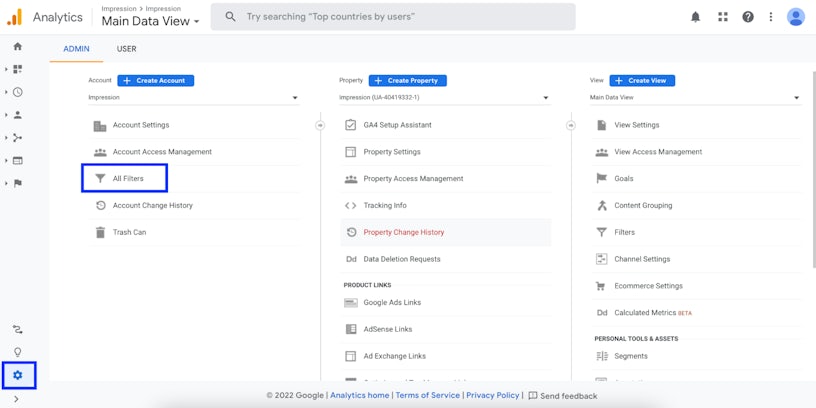
With Google Analytics, we recommend removing data from non-converting traffic such as bots and internal stakeholder IP addresses (normally IP addresses of your business’s own offices and any agencies you work with). The process for excluding IP addresses is as follows:
- Create a new filter – Admin → All Filters → + Add Filter
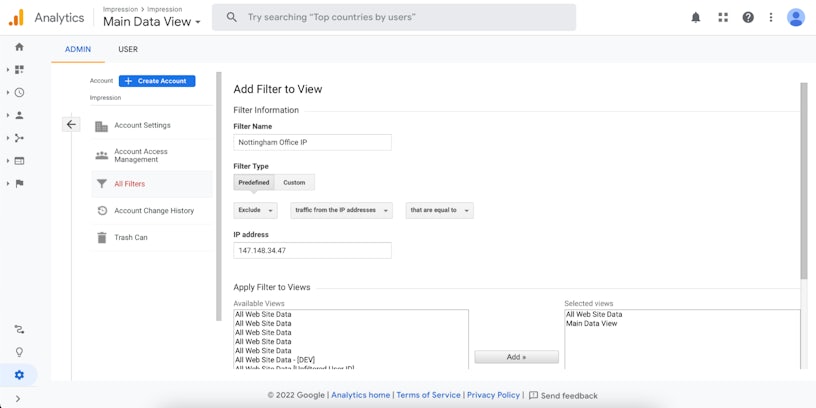
- Choose a name for the filter, such as ‘company IP’ and leave the type as ‘predefined’
- From the filter type drop-down menu, choose ‘exclude’
- From the next drop-down, choose ‘traffic from the IP addresses’ then choose ‘that are equal to’ from the final drop-down.
- Enter the IP address into the box that appears and add the views that you want to apply the filter to with the tool at the bottom of the page (you most likely want to apply it to whichever view you tend to use for your main audience data)
Quick tip: if you’re using Shopify, you will sometimes find that they inject the code for your Analytics directly into your website. We’ve encountered clients that have deployed the Analytics code themselves, meaning there are duplicate tags on the website, skewing their data. Do a quick check on your website to make sure you only have one Analytics tag present.
Check out our measurement and analytics guides for more tips on setting up your tracking properly.
Start by looking at your Analytics data
A successful CRO strategy typically starts with looking into your Analytics data. Now that you’ve filtered out traffic from bots and internal IPs, you’ll want to allow some time for more data collection to ensure it’s clean and accurate data you’re looking at. Once you have enough data, you can start looking into your analytics for potentially underperforming areas of the website.
We’d recommend familiarising yourself with the following Google Analytics reports
- Devices report: this report can be used to look at what devices users are visiting your website on. You’ll be able to see a breakdown of all your key metrics (bounce rate, conversion rate, time on site etc) by device too, which will help to highlight any underperforming devices.
You can find this report by navigating to Audience > Mobile > Overview - Acquisition channel report: this report can be used to look at which channels are driving traffic to your website. You’ll also be able to see all the standard metrics, which will allow you to highlight any underperforming channels.
You can find this report by navigating to Acquisition > All Traffic > Channels - Site content reports: there are a number of different reports under the site content section. The “All Pages”, “Landing Pages” and “Exit Pages” will be the most useful.
The “All Pages” report allows you to look at how many page views your individual pages are receiving, showing the key page metrics too so you can identify underperforming areas.
The “Landing Pages” report is useful for looking at what pages your users are landing on when they first visit your website, you can also utilise secondary dimensions here to break the data down even further and look at a channel level.
And finally, the “Exit Pages” report will show you what pages your website visitors are exiting on, allowing you to identify pages that might be causing problems for users.
These reports can be found by navigating to Behaviour > Site Content
Using the above reports, you can then start to pull together a list of areas on your website which are potentially underperforming.
For a more in-depth guide on where to start in your Google Analytics account, check out our Beginner’s Guide to Google Analytics.
Visual Intelligence Data (heatmaps, scrollmaps and session recordings)
As an agency, we use certain techniques to help us identify areas that a site could improve on, and one that we strongly recommend is analysing Visual Intelligence Data.
So what is Visual Intelligence Data? Using our testing partner, VWO, we have access to a number of different tools:
- Heatmapping
- Scrollmaps
- Session recordings
These tools are particularly useful because they allow us to look at how users are interacting with your website. We can see exactly where users are clicking on the page, how far they’re scrolling and it helps highlight any potential pain points that users may have. For example, we might be able to see that users aren’t interacting with an element that you considered important, or that users spend a lot of time on an area of the page that you haven’t paid much attention to.
If you have access to a Visual Intelligence tool, we’d recommend taking a look at the areas of your website that you highlighted as underperforming when digging into your Analytics data. We’d also recommend you look at heat maps and scroll maps for key pages across your journey such as your homepage, category and product pages.
Some other tools which offer similar features are Hotjar, Lucky Orange and Crazy Egg.
A/B tests and multivariate testing
Testing different versions and optimisations to your web pages is a key tool of successful long-term CRO strategies. These tests work on a basic principle: you create alternative versions of a page and display each version to a random subset of your visitors. When enough people have seen each version, you compare conversion rates and other key behaviour metrics to see which version was the most successful.
A/B testing (sometimes referred to as split-testing) is the most common form of testing for most websites. As the name suggests, you change a single element on a page and run the new version against the original. If the new version converts better, you change the page permanently, if it doesn’t, you plan another test. CRO software like VWO will help you to set up and run the tests, bringing them to an end when you have enough data for the result to be statistically significant.
Multivariate testing involves making more changes. As such, it requires the audience to be split into smaller groups and can take longer to arrive at a result depending on how much traffic you have coming to your website, it does, however, allow you to identify which elements are the most important for conversion and to transform the page in one go.
It is also important to remember that the lower the traffic to your website, the bigger the difference between the pages needs to be to reach statistical significance. This is because it takes more to demonstrate that a result isn’t a fluke when the sample size is smaller.
CRO isn’t just a one-time project
CRO is an ongoing, iterative practice. Sure, there are a few quick fixes, but to see the biggest improvements, you need to keep at it over time, base your hypothesis on data and build on the changes you’ve already made.
With A/B and multivariate testing, it’s important to remember that not all your tests will be successful. Does that mean engaging in these tests is a waste of time? Absolutely not. Good CRO is as much about the failed results as it is about the successes, as long as you learn from each and every one. No matter the result of the test, always ask this question: why did it turn out like that?
Asking yourself and your team that question and following through with a logical, reasoned evaluation will give you a deeper understanding of what your audience is looking for and how your website can meet their needs.
A practical example
Perhaps you try a few split-tests that involve changing the colour of CTA buttons (which you know are underperforming thanks to heatmap analysis), but you haven’t seen a difference. This could be a sign that colour is not an important factor in this instance and that it could be a wider issue with the design of the site or the strength of your content.
Alternatively, several successful colour tests could indicate that customers are influenced heavily by colour and imagery on your site, which should inform you that it will be productive to try new tests based on this hypothesis. In this way, successful or failed tests can both highlight areas for improvement and the next stage of your strategy.
As we mentioned earlier, a strength of CRO is its ability to inform your other marketing strategies. As you conduct tests and make changes that have a positive impact on your conversion rate, you will inevitably learn what your audience values. This information can be translated easily into advertising campaigns and has applications for organic and social channels as well.
Seeing the wider applications for the data you gather does take a degree of critical thinking, but your goal is to discover what your audience sees as most important. This will become apparent after just a few months of CRO, but the more you stick with it, the more you learn.
Further reading
If you want to learn more about CRO, here are some resources that can help you increase your knowledge:
- Stay up to date with our latest CRO blog posts
- VWO’s resource library, which includes their latest whitepapers, blogs and case studies
- Stay up to date with the latest CRO news via the ConversionXL blog
If CRO sounds useful for your business, but your team doesn’t have the capacity to give it the time it needs, why not have a conversation with Impression about how we can help? Start by visiting our CRO service page to find out more.


