
Google Analytics is a “freemium” web analytics tool offered by Google. It enables website owners to track a wide range of data regarding web traffic, user behaviour and site performance. In this guide, we run through the basics of Google Analytics, including how it works, how to navigate the interface and how to understand some of the key reports involved.
- Why should you use Google Analytics?
- How does Google Analytics work?
- How are Google Analytics accounts organised?
- How to navigate Google Analytics
- Understanding and navigating reports
- Useful metrics
- Dimensions and metrics
- Visualising Google Analytics reports
- Sharing and saving reports
- Google Analytics dashboards
- Basic reporting
- Campaign & conversion tracking
- Goals and conversions
Why should you use Google Analytics?
Within marketing exists the concept of a purchase funnel. Within each phase of this funnel are customer interactions which can be typically classified into the following categories;
- Aquisition – acquiring interested users and building awareness
- Behaviours – engaged users who interact with a business
- Conversion – Users who become customers and transact with a business
Within digital marketing, tracking and measuring the marketing funnel, often to a very granular level is highly achievable. Compared to the offline world, we are able to capture more data, more easily, and act on this data to make better-informed decisions.
In addition, digital analytics is versatile and can be used to benefit a wide variety of businesses. Publishers can use digital analytics to cultivate their audience and align advertising with user intent, e-commerce retailers are better able to understand purchasing actions, and lead generation sites are able to effectively capture valuable information and leads, which make up their sales pipeline.
All of the information captured within Google Analytics is available within various “reports”, which are easily accessible via the user interface. These reports can then be analysed to better understand customers and their journey across a website and ultimately inform strategic marketing decisions.
How does Google Analytics work?
Before tracking website within Google Analytics, you’ll first need to sign up for an account and set your website up property (we’ll cover properties in more detail later). Following this, you’ll then need to install a simple piece of javascript tracking code to every page on your website.
This code will then collect anonymous data in relation to how a user interacted with your web pages. As mentioned previously, Google Analytics delivers the stored data in the form of reports, and it’s the tracking code’s job to collect and send this information so that it can be processed into these reports.
The processed data is organised based on pre-existing criteria, for example, whether the user arrived at your site via a mobile or desktop device. However, it’s possible to configure the settings in order to customise your data.
This can be particularly useful when there’s a need to exclude or segregate data, for example, if you only want to see visitors and their associated behaviour arriving at your site from a particular region. In this example, a filter could be applied to exclude traffic data from regions within which your business does not operate or want to reach.
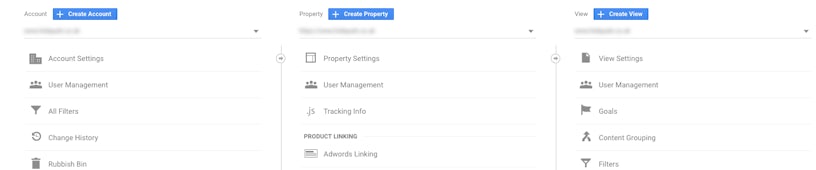
How are Google Analytics accounts organised?
Google Analytics account is set up in a hierarchy, with each account having the potential to have multiple properties. Each property can then also have multiple views. This hierarchy essentially provides the opportunity to manage and organise data effectively where required.
Below is a summary of each level within the hierarchy;
Accounts – enable you to organise the way in which data is collected from a number of websites, and is where user permission levels are set.
Properties – each account have at least one property, using one unique tracking ID contained within the JavaScript tracking code. Each account can contain multiple properties, and this may be useful is there’s a requirement to capture data from both a website and a mobile app (for example)
Views – each account can have multiple views. These views determine how your report data is represented and can be configured accordingly, using filters. It’s also at view level where Goals can be configured to capture performance information, most commonly leads and associated actions that make up the key performance indicators of your digital marketing efforts.
How to navigate Google Analytics
In a situation where you have multiple accounts, properties and views, you can easily navigate through all of these elements, both from the Analytics homepage and from within the interface of an account;
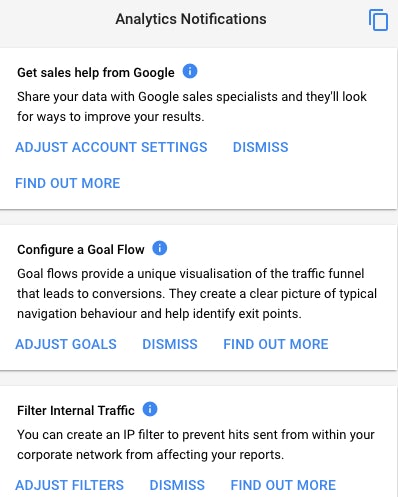
The bell icon in the top right-hand corner of the interface contains notifications related to your accounts, properties and views

Clicking this will pull down a menu that enables you to view your notifications
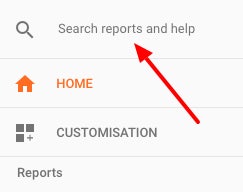
In the top left-hand corner of any given view is a search feature, which you can use to search and locate desired reports
Use the left-hand menu to navigate and access reports
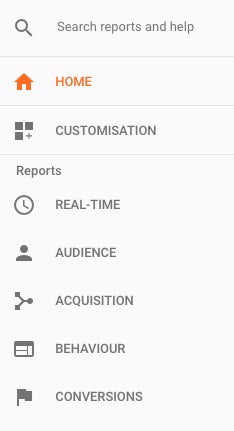
There are several reports available, and now we’ll briefly cover each and the information available within them;
Real-Time Reports – as the name suggests, allows you to view active users live on your site and some specific information, such as where they arrived from, which page they are visiting.
Audience Reports – provide insights into the demographics of your users, where they are located, whether they are a new or returning visitor and how engaged they were with the content of your website.
Aquisition Reports – details the channel from which your users arrived, such as; “Organic” (unpaid search), “CPC” (“cost per click” or paid search), “Referral” (traffic that comes from another website), “Social” (from a social network).
Behaviour Reports – includes specific data related to user engagement, such as the pages they landed on when arriving at your site, they pages they then navigated, and from which page they left your website.
Conversion Reports – contains information regarding the goals you may have set up to track the performance and success of your digital marketing efforts, such as captured leads and revenue data via e-commerce tracking.
Understanding and navigating reports
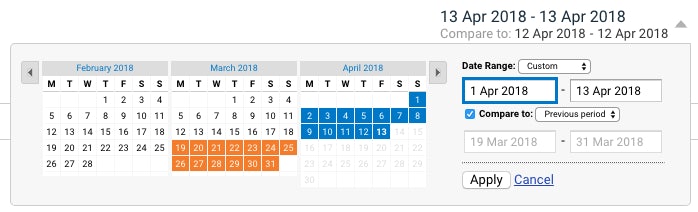
When browsing any given report, there is a date range in the top right-hand cover of the pages. This date range can be modified to view a specific time period for the data within the report and in addition can be then compared against different periods in time, including the previous year, previous period or a custom time-frame.
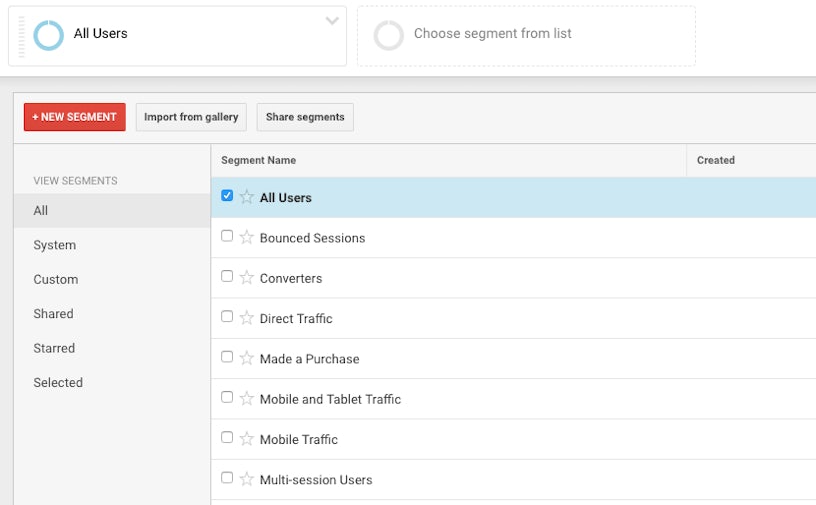
At the top of each report, there is an option to segment the data. Segments can be used to view a specific data set and compare metrics.
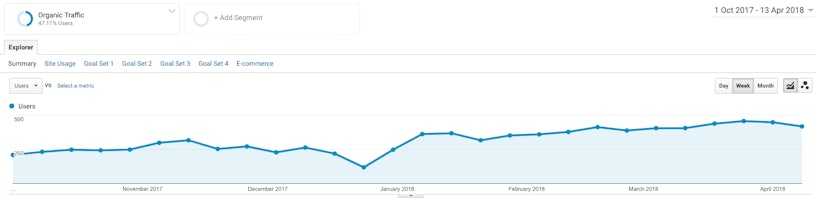
Below the segment picker, various metrics appear, and most prominently, a line graph. This line graph shows the selected data point and the number of users across a specific date range. As mentioned above, the date range can be toggled to expand, reduce and compare historical and comparative data. You can view this data by day, week or month.
In the example below, I have segmented the data to view organic traffic, on a weekly basis since the 1st of October 2017;
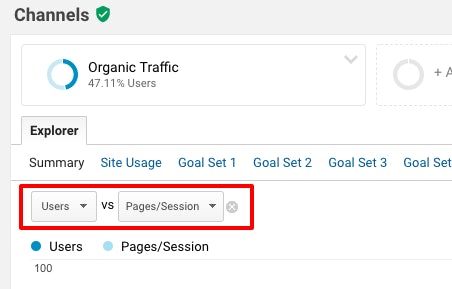
Analytics also allows you to compare metrics within any given report. In the example below, I can view both my users, vs the average time on site over a specific duration;
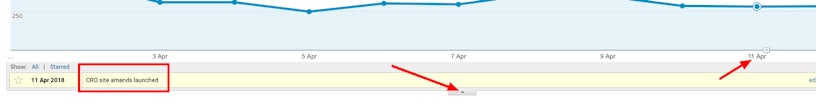
By clicking the small downwards arrow below the line graph, it’s possible to add annotations to report data. This is useful in many scenarios, for example, if you’ve made key modification to your website which you’re expecting to have an impact on your reporting metrics;
Useful metrics
Below the line graph of the Audience Overview report are several useful metrics, which are summarised below;
“Sessions” – the total number of sessions for the given date range.
“Users” – the total number of users that visited for the given date range.
“New Users” – related to the first time visitors to your site – triggered by a unique client id which is created by your tracking code
“Pageviews” – the total number of times pages that included your Analytics tracking code was displayed to users. This includes repeated viewings of a single page by the same user.
“Pages per session” – the average number of pages viewed during each session. This also includes repeated viewings of a single page.
“Average session duration” – the average length of a session based on users that visited your site in the selected date range.
“Bounce rate” – the percentage of users who left after viewing a single page on your site and taking no additional action.
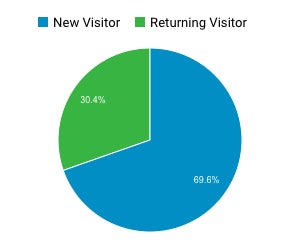
New Vs Returning – And to the right of these metrics is a pie chart which displays the percentage of new vs returning visitors;
Dimensions and metrics
Within each report, the data is made up of both dimensions and metrics. Dimensions are essentially entities, which data can be attributed to, for example, a city, country or language. Metrics, on the other hand, are quantitative measurements, such as sessions.
Dimensions can be combined with metrics to provide a granular data view within Google Analytics reports. As a basic example, it’s possible to see the number of sessions (metric), derived from people arriving at your site from London (dimension).
Every dimension and metric has a “scope”, which is either a user-level, session-level, or hit-level scope, and so combining dimensions and metrics is logical when they share the same scope, and therefore not every metric can be combined with a dimension.
Visualising Google Analytics reports
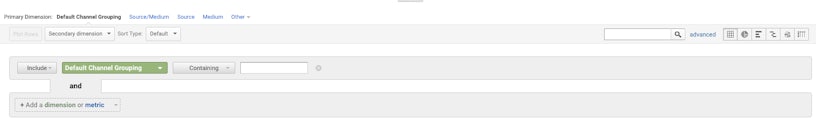
It’s possible to manipulate the data within your reports so that you’re able to view the data in a variety of ways. By default, the reporting data is displayed in tables, which can be sorted to view ascending and descending data. In addition, you may find it useful at times to filter your data on a more granular level.
Clicking on the “advanced” button at the top of the table will open the advanced filtering option;
In addition to filtering your data, there’s also the option to change the way in which it’s presented. As mentioned above, the default view is a table, however, it’s possible to also visualise data in the following ways
![]()
Pie Chart – view percentage splits across metrics
Performance – Bar graph view for comparing segments
Comparision – Bar graph view to show if data entities are performing in line with the site average
Pivot – Pivot table for comparing different dimensions and their values
Sharing and saving reports
![]()
At the top of every report is a selection of options which allow you to share or save your reports in a number of ways. Reports can be saved with their “current configuration”, and will then appear within the saved reports area which is housed within the customisation overview.
Reports can also be exported into a variety of formats including CSV’s and PDFs and saved to a desktop, as well as being shared directly with an email inbox.
Google Analytics dashboards
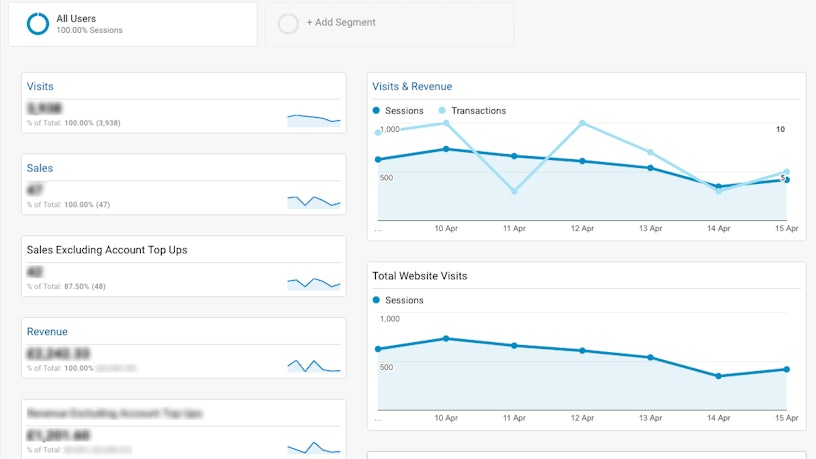
Dashboards can be used to share Google Analytics information and may have a variety of applications. The beauty of these dashboards is their flexibility and how easy they are for multiple stakeholders to access and visualise site performance.
Dashboards can be used to provide overviews of KPI’s in the form of visual widgets, which can then be segmented in the same way as other reports with data available to be compared historically or over time.
Basic reporting
The following section of this guide provides an overview of each reporting area within Google Analytics.
Active User Report – This report displays the number of users who initiated at least one session on your website in the last day, seven, fourteen and 30 days
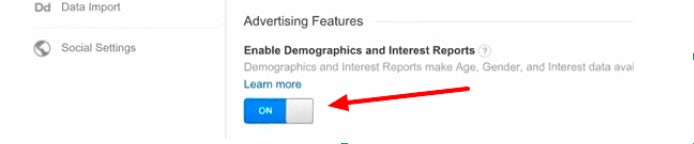
Demographic and Interests Report – Before taking advantage of the data within this report, you must first enable the demographics and interests report within the associated Google Analytic property;
This reports can provide a real insight into your websites user base, which in turn can better inform future marketing decisions and ensure that your content is effectively aligned with your target audience. In these reports, you can see information relating to the age and gender of your users, as well as information on their content preferences.
Geographic Report – This report provides insight into where your audience is physically located, and how they interact with your site. The data contained in these reports can be helpful if you’re an international business looking to address specific Geographical regions, as it can help shape your content strategy and marketing efforts. It can also help you to identify where you have a large audience yet substandard site performance and address issues accordingly.
Technology and Mobile Report – This report enables you to identify on which technologies your users are accessing and consuming your website’s content – for example, the device they are using and which browser.
Acquisition Reports – Within this section of Google Analytics, you’re able to identify how users are arriving at your site, including the traffic source, and channel and referral reports.
Traffic Sources – There are several traffic sources from which data is available – these are;
- “Organic” – used to identify traffic that arrived on your site through unpaid search like a non-paid Google Search result.
- “CPC” – indicates traffic that arrived through a paid search campaign like Google AdWords text ads.
- “Referral” – is used for traffic that arrived on your site after the user clicked on a website other than a search engine.
- “Email” – represents traffic that came from an email marketing campaign.
- “(none)” – is applied to users that come directly to your site by typing your URL directly into a browser.
Channel reports – Traffic sources are grouped into categories, also referred to as channels. The most common are Organic, Paid, Direct, Social Referal and Display. When viewing traffic by channel, it’s also possible to see the source of the traffic and the medium. For example, organic traffic (source) coming from Google (medium).
Referral Report – The referral report enables you to see the sites which are linking to your website and which are also passing on traffic.
Behaviour Report – Drilling further into the behaviour report will allow you to see how users are behaving across your website. Here are some of the reports which you’ll likely find the most valuable;
All pages – This report contains the pageviews metric, which allows you to see how frequently each page on your site was viewed, and by default will display the most frequently visited URLs in descending order. Within this report, you can also see how engaged users are with your content via the average time on page and bounce rate metrics.
Content Drilldown – The content drilldown report groups pages logically based on the structure of your website and is a useful report to access when trying to understand the performance of particular sections of your site in isolation.
Landing Pages – The landing pages report lists outs where users first arrived at your website. This is a useful report to use on a granular level when looking to improve engagement with specific pages. Identifying pages with a high bounce rate, for example, may indicate that your pages aren’t well aligned with your user’s expectations.
Exit Pages – As the name suggests, this reports shows you from which pages users left your website. Analysing the report can help you to identify where people are leaving your website, that you may not wish them to.
Campaign & conversion tracking
Google Analytics allows you to track your online marketing efforts, regardless of their form, via the implementation of “campaign tagging”. This may include tracking paid search efforts, the performance of social media advertising campaigns or email marketing activity.
Campaign tagging essentially involves amending the URLs used within your marketing activity to include tracking parameters which pass data back into Google Analytics.
Within these custom URL parameters, you can use up to five different campaign tags, which will help you to identify particular information regarding the performance of your campaigns. These are;
Medium – How your marketing messages were communicated to the users, for example, “email” or “social”
Source – Specifically here the user arrives at your site from within the medium. For example, if the medium is “social”, and you’re running some paid advertising, then the source might be “Facebook” if it’s Facebook Advertising.
Campaign – Used to identify the name of the marketing campaign itself, ie – “Facebook Advertising Campaign 2018”
Content – Typically used when testing different promotions in tandem, by using different content as part of the same campaign.
Term – This tag is used to identify specific keywords within paid search campaigns, outside of Google. Is you’re advertising on Google, then it’s possible (and recommended) to set up auto-tagging.
Although the above may sound technical, it can be implemented very easily with the aid of Google’s URL Builder
Goals and conversions
Setting up Goals within Google Analytics allows you to measure the performance of your website in line with desired and expected user actions, for example, submitting a messaged via a contact form or purchasing a product – basically anything you determine as contributing towards the success of your marketing efforts and business goals. These Goals within Google Analytics are referred to as “conversions”.
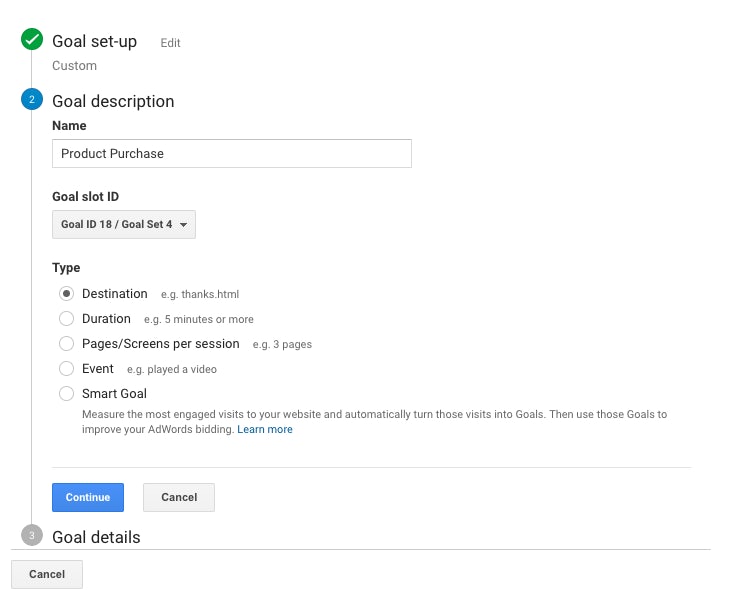
In order to set up a goal, you’ll need to take the following steps;
Go to the Admin section. Then, under “Views,” click “Goals.”
Choose one of four Goal types. Each of these types is triggered by a particular user action.
“Destination” is when a user reaches a specific page on your site such as a thank-you page
“Duration,” is based on the length of a user’s session
“Pages or Screens” is based on how many pages a user views in a session
“Events,” is for tracking specific actions your site
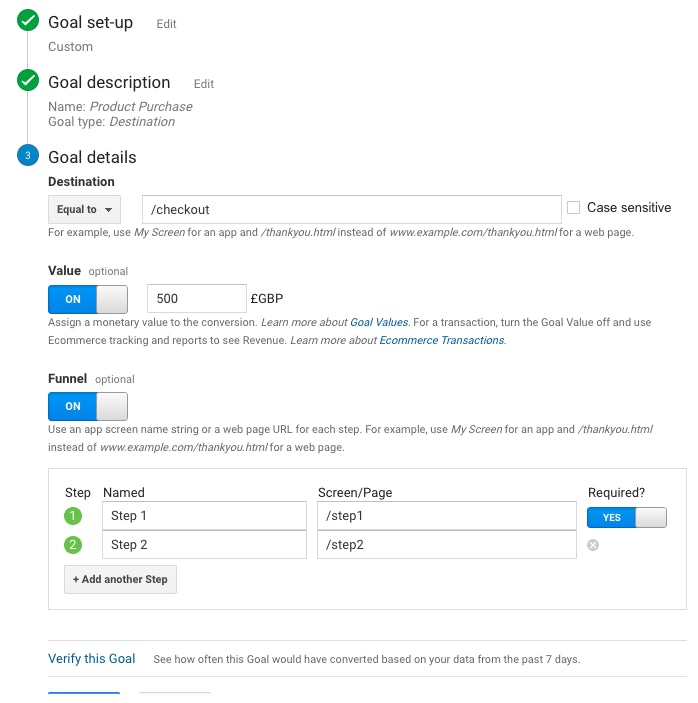
Once complete, you then have the option to assign a value to your goals, and this can be useful if you know the monetary value of each conversation, and if each conversion is worth the same value. If your goal requires users following a set conversion path, then you may also want to analyse the effectiveness of this path as part of the overall conversion funnel. Turn to enable both of these settings, then toggle the switches to “ON” and populate the data as required;
Hopefully, this guide has provided a good overview of Google Analytics, and how it can be used. If you require any support with Google Analytics, Impression provides analytics training, delivered by Google accredited search marketing strategists.


