
Upon researching Media Effectiveness you might have stumbled across the following terms: media mix modelling, econometric modelling, incrementality testing, synthetic data, multiple linear regression, Bayesian, frequentist, R-squared, geo-experiments and multi-touch attribution.
You’re not alone if you read all this and find the world of Media Effectiveness a little intimidating. For a discipline based on transparency and coherence, Media Effectiveness is encompassed with technical terms. If you’re eager to learn about Media Effectiveness measurement and all the business insights it can provide, then you’ve come to the right place!
This blog will outline how to approach Media Effectiveness from first principles, the crucial data-driven insights you’ll get from it and list some benefits & limitations of doing so.
Why Media Effectiveness?
For decades digital marketers have used digital multi-touch attribution web analytics to track and assign credit to multiple media channels based on “touchpoints” within the customer journey. In recent years this type of measurement has become increasingly flawed as a result of the rise in usage of multiple digital devices, the decaying lifetime of third-party cookies, and device and app-based privacy controls. To address this challenge, many marketers are turning to Media Effectiveness measurement techniques in order to enhance decision-making processes. Media Effectiveness measurement utilises both modelling and testing to ensure that it remains the most reliable and trustworthy method of marketing measurement.
Media mix modelling
Digital marketing has become an integral part of modern business strategies, enabling companies to reach and engage their target audiences online. However, making informed decisions in digital marketing requires more than just intuition; it demands a data-driven approach. Statistical modelling is a powerful tool that can be used to help marketers extract valuable insights, predict future trends, and optimise the impact of their campaigns.

One type of statistical modelling is econometric modelling. Econometric modelling is a broad term that encompasses the modelling of a wide range of economic factors and relationships, not limited to just marketing. Media mix modelling and marketing mix modelling, often abbreviated to “MMM” are both subsets of econometric modelling. In the context of digital marketing, both are considered interchangeable. Media mix modelling is a type of econometric model specifically tailored to digital marketing. It is the media mix model that is most commonly used among Media Effectiveness specialists.
If you’re seeking data-driven insights into the effectiveness of various media channels, the delayed effects of advertising, the diminishing returns of media spend, and media contribution to KPIs and budget forecasts then media mix modelling is the way to go about it.
Before you attempt media mix modelling, there are some requirements that are absolutely essential:
- Good quality data
- Sufficient and clean historical data on marketing activities, sales, and other relevant metrics are essential. Typically a minimum of two to three years of granular data, such as daily or weekly, is recommended. This ensures the model can capture variations and trends adequately.
- Clearly defined business objectives
- Articulate the objectives that the model aims to address. These objectives could include optimising marketing budget allocation, understanding channel contributions, insights into the delayed effects or predicting sales impact.
Provided you have good quality data at your disposal and clearly defined business objectives you aim to answer, the next thing to do is to go ahead and commence the modelling process.
Be cautious of automated MMMs as they can’t always capture the complexities of your business. It is recommended that you opt for a bespoke model as you’ll be able to make the relevant changes to best fit your business. Take comfort from the fact that there are a large number of bespoke model-building packages out there such as LightweightMMM, Robyn and PyMC-Marketing.
Regardless of whether you invest in automated MMMs or begin building your own media mix model, the nature of these models varies. The most common statistical technique for MMM is multiple linear regression. Multiple linear regression is a form of a statistical model that uses two or more independent variables (marketing inputs) to predict the dependent variable (marketing output). This technique relies heavily on identifying the linear correlations and associations between variables. Within the linear regression model, certain variable transformations can be made in order to account for delayed effects and the effects of diminishing returns.
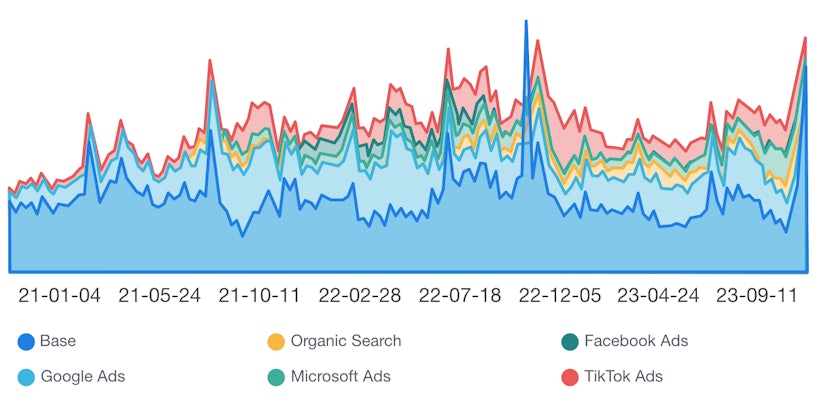
It is good practice when conducting an MMM to account for the “base” in your model. The base contains anything that might contribute to the outcome in the absence of any marketing activity. Often, for brands that are well known and have already developed their long-term brand building, this “base” will take up the majority and is generally increasing over time. Accounting for the base in your model provides a stronger understanding of the impact of your marketing efforts and avoids incorrect channel contributions.
Whether the nature of your MMM is multiple linear regression or anything else, you might ask yourself: “Do I trust these results?”. When conducting media mix modelling it is important to validate the model’s accuracy and reliability using various techniques such as measuring R-squared or comparing model predictions with actual outcomes.
R-squared is simply a measure of how well the model can account for the variance in the data, hence the closer R-squared is to 1 the better the model fit. There is no “acceptable” value, but as a rule of thumb, I would recommend aiming for an R-squared of at least 0.65 when conducting an MMM. Additionally, it’s important to note that a really good R-squared value doesn’t necessarily mean you have an excellent model. Depending on the nature of your model, it is important to note that there are other statistics, such as LOO-CV, that serve similar purposes. Which statistic you use to compare models should depend on the nature of your models.
Once you have a well-constructed MMM which aligns with your business and that fits the data really well you can begin to assess what tangible impacts these results might have on your business. Some examples include:
- Optimal budget allocation:
- MMM can be used to identify the most effective media channels and activities that drive sales or desired outcomes. As a result, you can allocate marketing budget more efficiently by investing in channels that deliver a higher ROAS.
- MMM can be used to identify the most effective media channels and activities that drive sales or desired outcomes. As a result, you can allocate marketing budget more efficiently by investing in channels that deliver a higher ROAS.
- Enhance overall strategy:
- MMM reveals the relative contributions of each media channel, allowing you to understand the holistic impact of your current strategy. As a result, you can refine your strategies based on data-driven insights, leading to more effective and efficient campaigns.
- MMM reveals the relative contributions of each media channel, allowing you to understand the holistic impact of your current strategy. As a result, you can refine your strategies based on data-driven insights, leading to more effective and efficient campaigns.
- Data-driven decision-making:
- MMM provides a data-driven approach to decision-making, eliminating the need for MTA or guesswork. As a result, you can make more informed and strategic decisions based on concrete evidence from your marketing performance.
- MMM provides a data-driven approach to decision-making, eliminating the need for MTA or guesswork. As a result, you can make more informed and strategic decisions based on concrete evidence from your marketing performance.
- Forecasting and planning:
- MMM uses historical data and identifies trends, enabling you to forecast future performance under different scenarios. As a result, you can make informed decisions about resource allocation, product launches, and overall business strategy.
- MMM uses historical data and identifies trends, enabling you to forecast future performance under different scenarios. As a result, you can make informed decisions about resource allocation, product launches, and overall business strategy.
- Competitive advantages:
- MMM can give your business a competitive edge by taking into account competitor activity when optimising marketing strategies and resource allocation. By leveraging MMM, you can be sure to outperform your competitors in terms of marketing efficiency and effectiveness.
- MMM can give your business a competitive edge by taking into account competitor activity when optimising marketing strategies and resource allocation. By leveraging MMM, you can be sure to outperform your competitors in terms of marketing efficiency and effectiveness.
- Testing insights:
- MMM can be used to estimate ROAS. Often these models provide a measure of uncertainty with these estimates. It is usually implied that the channel with the largest uncertainty requires some testing in order to reduce this uncertainty in future models.
By utilising the insights generated via MMM, you can align your marketing strategy with data-driven decision-making, leading to a tangible improvement in business performance.
Incrementality testing
Accurately measuring whether or not, and to what extent, a particular marketing channel or campaign has an impact on your business is a common challenge faced in digital marketing. All forms of advertising should lead to incremental sales, even long-term brand-building activity, but it’s quantifying the contribution that advertising has that marketers find particularly challenging. If you’re seeking ways to accurately measure and assign credit or impact to media channels to strengthen your understanding of what performs best then testing is definitely something you should add to the toolbox.
In the world of Media Effectiveness, the most frequently used method of testing is incrementality testing. Incrementality testing is a statistical test used in digital marketing to assessing the true impact of a specific marketing intervention or campaign through the comparison of a treatment group with at least 1 other control group. The primary goal is to measure the incremental or additional value generated by a particular action, such as an advertising campaign or introducing a new media channel.
In a similar sense to modelling, before even thinking about incrementality testing you must make sure you have good quality data at your disposal and clearly defined business objectives you aim to answer.
- Good quality data
- Sufficient and clean historical data on the KPI you wish to measure split up by region, product or however you choose to group your data. Typically a minimum of one to two years of granular data, such as daily or weekly, is recommended.
- Sufficient and clean historical data on the KPI you wish to measure split up by region, product or however you choose to group your data. Typically a minimum of one to two years of granular data, such as daily or weekly, is recommended.
- Control of confounding variables
- When conducting an incrementality test, it is essential that the only thing you’re measuring is the thing you intend to. Any other changes made during the testing period could jeopardise the validity of the test.
- Clearly defined business objectives
- Clearly articulate the business objectives that the test aims to address.
- Clearly articulate the business objectives that the test aims to address.
- Risk assessments
- In the case where you’re testing for something that might negatively impact business performance, knowing when to stop the test becomes crucial. For instance, if you’re testing if a decrease in channel spend will have an effect on revenue, then you should determine the point at which insights from the test no longer outweigh the revenue lost.
Once you have these, you’re all set to conduct an incrementality test!
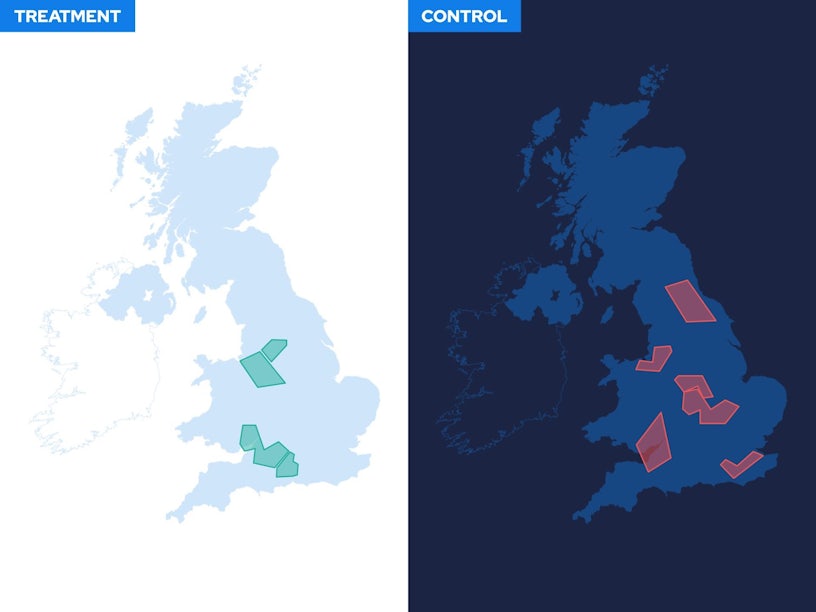
As mentioned above, an incrementality test consists of the comparison of a treatment group with at least 1 other control group. In the context of marketing, the treatment group refers to those that experience the marketing intervention and the control group refers to those that do not. There are two methods by which an incrementality test can be conducted: through A/B testing or using a synthetic control.
A/B testing, often referred to as “market matching”, is a subset of incrementality testing in which we compare one treatment group (A) with one control group (B) and assess the difference. This difference is known as “lift”. Although A/B testing is based on sound statistical principles, it doesn’t account for the effects of individual differences. For instance, if you group by location, the slight differences between the target audiences of each location may negatively impact the validity of the test.
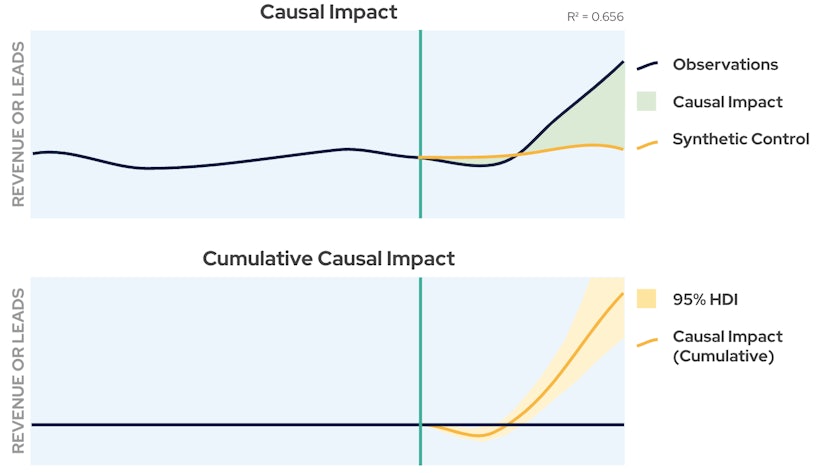
Testing with a synthetic control on the other hand eliminates this flaw. A synthetic control-based incrementality test compares a treatment group with an artificial control group and assesses the lift. The artificial control group is derived by modelling the treatment group at the pre-treatment stage and then forecasting what would’ve happened to the treatment group in the absence of the treatment. There are a large number of ways to do this such as taking weighted averages of other control groups, using linear regression or time series forecasting methods.
Incrementality testing is generally quite quick to implement and relies on objective data, hence reducing biases that may influence decision-making. The results are derived from actual user behaviour and are generally easy to interpret. Additionally, there are lots of easy-to-use software out there to conduct incrementality testing of any nature, such as CausalImpact and CausalPy.
As mentioned previously, incremental testing can be conducted using geographical location. We call these types of tests geo-experiments. While incrementality testing is a broader concept, geo-experiments represent a specific type of incrementality testing focused on geographic variations. In other words, geo-experiments are an element of incrementality testing, and the principles of incrementality testing can be applied to understand the causal impact of marketing interventions, whether they are geo-specific or not.
Having all these different methods of testing is great, but how do you know which one to use and when?
Geo-experiments specifically concentrate on geographic regions, while customer testing may focus on a broader set of variables impacting the customer experience. If you aim to measure and optimise marketing strategies by region, geo-experiments are the ones to use, while customer testing is better suited when you aim to optimise the overall customer experience. A/B testing is well-suited for comparing two groups with a randomised design, while synthetic control is useful when randomisation is not feasible, and researchers seek to estimate the causal impact on a single unit.
Once you have correctly conducted an incrementality test which controls for confounding variables and has operated within the specified risk assessment, you can begin to assess what tangible impacts these results might have on your business. Some examples include:
- Optimise Spend
- Incrementality testing allows you to allocate marketing budget more efficiently, focusing on the channels that provide the highest incremental lift.
- Incrementality testing allows you to allocate marketing budget more efficiently, focusing on the channels that provide the highest incremental lift.
- Decision making
- Incrementality testing promotes a data-driven culture within your business. Decisions about marketing strategies, product changes, or operational improvements are based on numerical evidence rather than assumptions.
- Incrementality testing promotes a data-driven culture within your business. Decisions about marketing strategies, product changes, or operational improvements are based on numerical evidence rather than assumptions.
- Mitigation of unwanted consequences
- By conducting an incrementality test on a small scale first, you can assess the unwanted consequences of certain strategies. This allows your businesses to identify and mitigate any negative impacts on other areas of the business.
- By conducting an incrementality test on a small scale first, you can assess the unwanted consequences of certain strategies. This allows your businesses to identify and mitigate any negative impacts on other areas of the business.
- Media mix model calibration
- Impact or lift estimates can be used to fine-tune your media mix model to give a better representation of your media mix, and hence to better inform your budget allocation forecasts.
Overall, there are multiple tangible impacts of incrementality testing on your business, ranging from cost savings and revenue growth to improved customer relationships and strategic decision-making. By rigorously measuring the incremental impact of various initiatives, businesses can adapt and thrive in a dynamic market environment. Calibrating your media mix model through incrementality testing is considered the gold standard in Media Effectiveness evaluation.
Bayesian vs Frequentist statistics
Statistical models involve the estimation of parameters. The parameters in an MMM are unknown quantities associated with each marketing input, such as channel spend or the delayed effects of advertising. These parameters are then estimated and used to indicate the strength and direction of the influence each marketing input has on your business performance.
Traditional statistical modelling utilises the frequentist framework. In frequentist statistics, parameters are treated as some unknown real value which we wish to estimate. Parameter estimation would then result in a singular point estimate and any uncertainty would be interpreted as the long-run frequency of events, hence the name “frequentist”. Uncertainty is quantified in the form of confidence intervals and is often expressed as a percentage level of confidence, such as 95%. If you were to repeatedly construct an MMM and estimate the parameters a large number of times, then the interval in which 95% of the estimates fall would be your 95% confidence interval.
However, there exists an alternative framework known as Bayesian statistics, which approaches estimation and uncertainty from a different perspective. In Bayesian statistics, parameters are treated as a random variable as opposed to a fixed real value. Parameter estimation would then result in an entire distribution of point estimates, each with its probability attached to it. Under a Bayesian framework, uncertainty is quantified in the form of the highest posterior density intervals, which are simply an interval containing the point estimates of the highest probability, such as 95%.
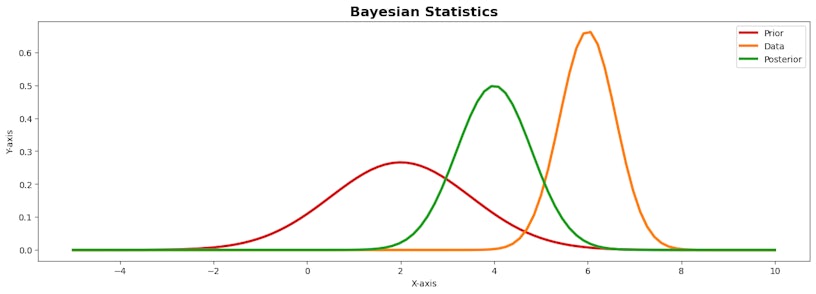
At the core of Bayesian statistics is Bayes’ theorem, a mathematical formula that describes how to update probabilities based on new evidence. In the context of MMM, this allows you to incorporate any business knowledge or beliefs such as marketing trends, pricing information or competitor activities into the modelling process in the form of a prior distribution. These prior distributions can be tailored towards the unique context of your business, hence ensuring recommendations derived from the MMM align with your unique goals and objectives. Once these prior distributions are fed into the model, the data is then introduced to update these distributions to produce what is called the posterior distribution.
Strengths and limitations: The Bayesian media mix model
- Incorporation of prior knowledge:
- This is particularly valuable when there is existing information or expert opinions available that will ensure your results align with your business.
- This is particularly valuable when there is existing information or expert opinions available that will ensure your results align with your business.
- Quantifies uncertainty:
- Bayesian models naturally quantify uncertainty. This can be advantageous in the decision-making process, allowing you to understand the range of possible outcomes and associated uncertainties.
- Bayesian models naturally quantify uncertainty. This can be advantageous in the decision-making process, allowing you to understand the range of possible outcomes and associated uncertainties.
- Computational complexity:
- Bayesian MMM can be computationally demanding. The need for numerical methods can make the estimation process time-consuming, particularly for large datasets or intricate models.
- Bayesian MMM can be computationally demanding. The need for numerical methods can make the estimation process time-consuming, particularly for large datasets or intricate models.
- Subjectivity in the priors:
- The choice of prior distributions can massively impact the results. Different analysts might have different opinions on appropriate priors. To counter this, elicit a larger variance in your prior distribution, this will allow your posterior to become more data-driven.
Strengths and limitations: The Frequentist media mix model
- Objectivity:
- Frequentist models are perceived as more objective, as they rely only on the observed data without incorporating subjective prior beliefs. This can be advantageous in situations where there is limited prior knowledge or when a more neutral approach is preferred.
- Frequentist models are perceived as more objective, as they rely only on the observed data without incorporating subjective prior beliefs. This can be advantageous in situations where there is limited prior knowledge or when a more neutral approach is preferred.
- Simple to implement:
- Frequentist methods, such as maximum likelihood estimation (MLE), often involve simpler computational procedures compared to Bayesian methods.
- Frequentist methods, such as maximum likelihood estimation (MLE), often involve simpler computational procedures compared to Bayesian methods.
- Fixed parameter interpretation:
- Frequentist models treat model parameters as fixed. This fixed interpretation might be limiting when dealing with complex, dynamic systems in which uncertainty is crucial to express.
- Frequentist models treat model parameters as fixed. This fixed interpretation might be limiting when dealing with complex, dynamic systems in which uncertainty is crucial to express.
- Small data sets:
- Frequentist methods may encounter challenges when dealing with small datasets, especially in situations where a Bayesian prior could provide valuable regularisation. Small sample sizes can lead to less stable parameter estimates.
Hopefully, you can see that once you strip away all the complicated jargon, the world of media effectiveness isn’t as intimidating as it’s perceived. This beginner’s guide has provided insights into the fundamental concepts, methodologies, and considerations that form the backbone of media effectiveness measurement.
As you delve deeper into the realm of Media Effectiveness, remember that it is an ever-changing field, constantly evolving with technology advancements and market dynamics. Armed with this knowledge, you are better equipped to optimise your media strategies and drive success in an ever-changing digital landscape!


