
In March of 2024 Google will be replacing the First Input Delay (FID) Core Web Vitals metric with Interaction to Next Paint (INP), but how important is this change and will it affect your website? We will explore these questions within our blog.
What is INP?
INP stands for Interaction to Next Paint. INP measures the time delay between when a visitor has interacted with an element on a page to the website processing the change and potentially displaying a change on the site if we’re talking about a graphical interaction such as an accordion, dropdown or slideshow. INP looks at all of these interactions performed while on a page and reports on the longest interaction seen.
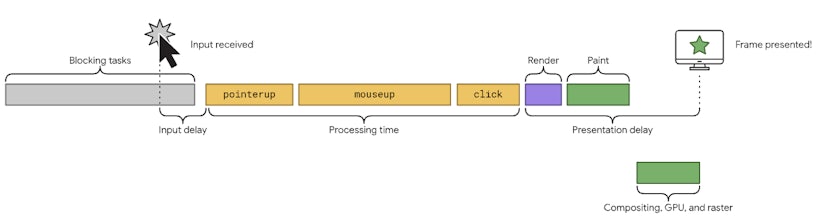
The three components of INP:
- Input Delay
- Any delay before the page can process the interaction, such as background tasks that need to be completed first.
- Processing Time
- The processing of an event handler(s) for the user interaction
- Presentation Delay
- Any rendering or painting undertaken to show interaction change. e.g an accordion opening or closing.
Additional Insight: If you’re wondering why the term ‘interaction’ is used for what you’re likely imagining as a click it’s because this not only includes mouse clicks but trackpad interactions, touchscreen taps or even a key press such as someone tabbing to what they want to ‘interact’ with and then pressing Enter or Return.
What is FID?
FID stands for First Input Delay. FID measures the time delay between the first element a visitor has interacted with and the website processing the change.
The difference between FID and INP
First Input Delay (FID) as the name implies only measures the first interaction and its delay between interaction and processing the change, whilst INP measures delays from all interactions performed on a single page and will report on the longest interaction delay seen, meaning that an INP score is not processed until the user leaves the page, either via navigating to another page, minimising their browser window, or navigating to another tab on their browser.
Why has Google chosen this change?
In most Google algorithm update changes, users tend to place themselves within Google’s shoes and try to imagine why they would be undertaking a specific action. In this scenario, we have FID that only measures the first delay between interaction and it being processed by the website. This is followed by INP, which measures all of these delays and it’s key to remember that not every interaction on the website will provide the same score.
A visual accordion feature that doesn’t feature anything fancy may process the interaction very quickly, whilst something like a slideshow interaction with its bulky JS and/or CSS may take considerably longer to process the interaction. Google will need a clear image of how the page performs, so of course it will collect the delay of all interactions performed on that page to get a more accurate representation of its performance.
What does this mean for me?
This means that you are only as strong as your weakest performing interaction, which can lead to people only addressing the one problem interaction. Instead, we would suggest reviewing your worst INP-scored pages first and assessing improvements to INP that can be made across all interactions on the page, not just the longest interaction the INP reported on.
We recommend not just optimising the one problem area, but rather optimise where you see room for improvement. This is because we shouldn’t be optimising for search engines but for the users. It’s also worth noting that multiple interactions may fall under poor, not just the one INP reported on.
How can I measure INP?
There are multiple ways to test INP, but here at Impression, we recommend using the Web-Vitals library found on GitHub. This allows these metrics to be sent to your Google Analytics 4 account.
We have utilised this method to create a universal customisable version that is added via Google Tag Manager, allowing for the information collected to be sent to your GA4 account or your preferred data collection tool (as long as it’s GTM compatible).
We have gone with the automatic collection of data to ensure we capture all interactions from all visitors to a website on all pages where GTM is present.
This ensures we have a full dataset of metrics collected in GA4, allowing us to identify where INP scores are larger on a specific page or page template. This also allows us to see which specific element is causing the largest INP score change on that page. We can provide detailed insights for clients on where they need to improve their INP metric.
The web-vitals method isn’t just restricted to INP alone. It can report on each core web vital metric (CLS, FID and LCP) along with other metrics such as TTFB and FCP allowing the same level of review attention for other metrics.
Below is our Custom HTML tag for use in Google Tag Manager that is set to fire on All Pages:
<script>
  (function () {

    function sendToGTM(data) {
      var debug = "";
      switch (data.name) {
        //In the case of CLS set debug location to the following
        case 'CLS':
          debug = data.attribution.largestShiftTarget;
          break;
        //In the case of FID set debug location to the following
        case 'FID':
          debug = data.attribution.eventTarget;
          break;
        //In the case of LCP set debug location to the following
        case 'LCP':
          debug = data.attribution.element;
          break;
        //In the case of INP set debug location to the following
        case 'INP':
          debug = {"attributionEntryType": data.attribution.entryType, "attributionName": data.attribution.name};
        break;
      }
      dataLayer.push({
        "event": "coreWebVitals",
        "coreWebVitalsEvent": data.name,
        "webVitalsMeasurement": {
          "name": data.name, //INP, FID, CLS, LCP, FCP or TTFB
          "id": data.id, //A unique ID for that metric's instance
          "value": data.value, //Metric value i.e 200ms
          "rating": data.rating, //Good, Needs Improvement or Poor
          "debug": debug, //Debug data
          "debug_all": data.attribution //Full debug data
        }
      });
    }
    //Ensure web-vitals script is present and run sendToGTM function with dataLayer push of data
    if(typeof webVitals == "undefined") { //If the web-vitals script wasnt found
      var script = document.createElement('script'); //web-vitals script creation
      script.src = 'https://unpkg.com/web-vitals@3/dist/web-vitals.attribution.iife.js'; //web-vitals script src attribute
      script.onload = function () {
        webVitals.onCLS(sendToGTM);
        webVitals.onFCP(sendToGTM);
        webVitals.onFID(sendToGTM);
        webVitals.onINP(sendToGTM);
        webVitals.onLCP(sendToGTM);
        webVitals.onTTFB(sendToGTM);
      };
      document.head.appendChild(script);
    } else { //If the web-vitals script is already present
      webVitals.onCLS(sendToGTM);
      webVitals.onFCP(sendToGTM);
      webVitals.onFID(sendToGTM);
      webVitals.onINP(sendToGTM);
      webVitals.onLCP(sendToGTM);
      webVitals.onTTFB(sendToGTM);
    }
  })();
</script>
We then need to create the relevant variables for the values we want to send, as we’re pushing this information to the dataLayer we grab it with a dataLayer variable:
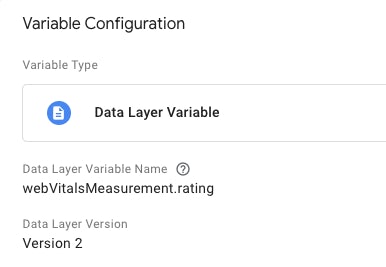
In the example above, we grabbed the top layer ‘webVitalsMeasurement’ and its rating value within. The same logic applies to the others too, so for ‘debug’ we would grab ‘webVitalsMeasurement.debug’.
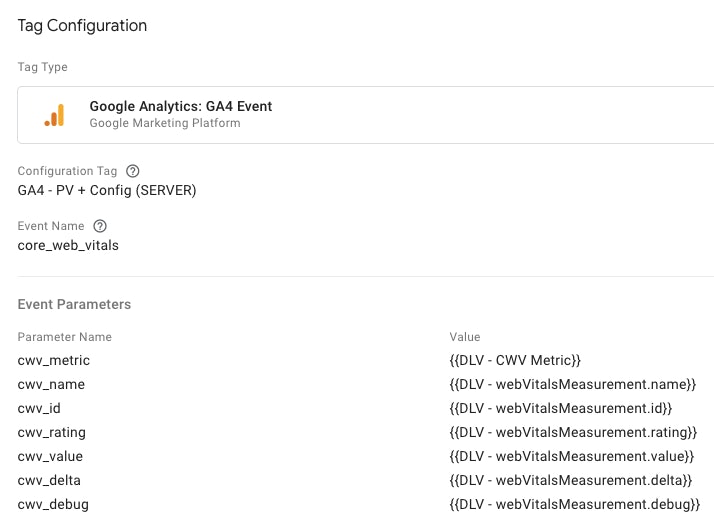
Once you have the relevant values you want to measure, we need to send this information to a data collection platform. We are going to send these to GA4 but you can send them to another platform as long as it’s GTM compatible.
The event name and event parameters you can customise accordingly, but for the parameter values we need to grab our newly created variables.
We then need to set up our trigger, which should be a custom event and looks for event line from within our Custom HTML tag:
"event": "coreWebVitals",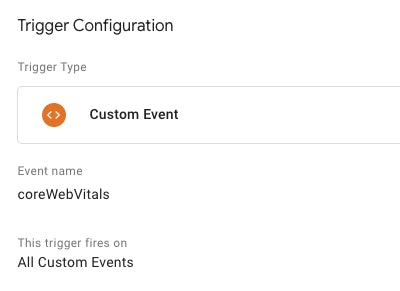
Should your event line on your Custom HTML code be defined as something different, you can update accordingly, but if you have copy and pasted our example, it will be coreWebVitals.
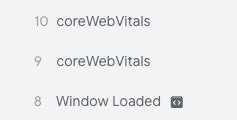
You can test these on Preview Mode of Google Tag Manager, the event name we just talked about will appear on the left when the relevant metric has been measured:
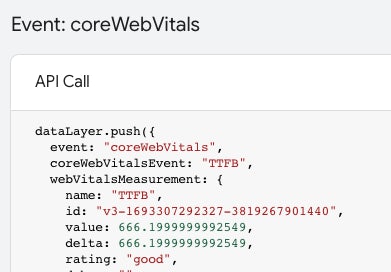
If you click on one of these it will let you see which CWV metric has been measured in that specific event you clicked on. If you have set up the GA4 tag, you can click on it which should appear in the tags fired and allow you to see the values recorded:
(Ensure the display variables option at the top right of the window is set to values to see values instead of variable names)
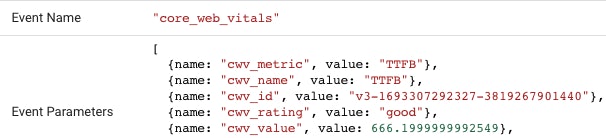
If you haven’t set up the GA4 tag yet, you can see the values by opening up the API call above the Output box that contains tag’s fired and not fired:
A point to consider with a Google Analytics 4 setup is that you will need to add the name, value, rating values as custom definitions within GA4 Admin’s section as they are custom parameters.
Reporting on INP and other CWV’s
If you are collecting this information within your Google Analytics account you’re likely wondering how to view this information in an easy-to-understand manner. The easiest answer is Looker Studio (previously known as Data Studio). We have created a report that contains 3 key elements for each CWV metric, including the upcoming INP metric.
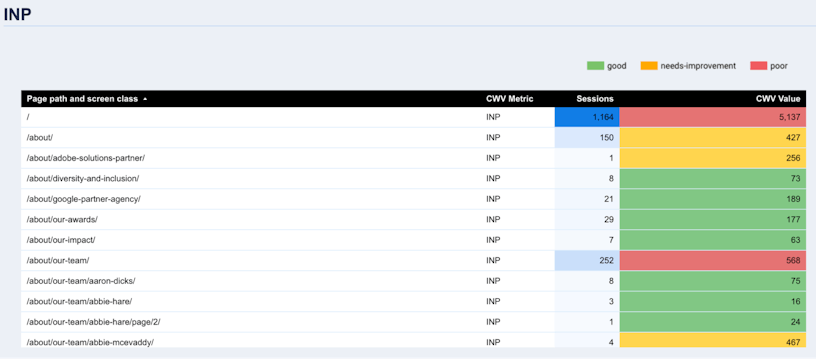
Table of pages: This allows us to see individual pages, which are performing well or require improvement and even allows us to organise by value. We collected the values recorded and stored in Google Analytics and used Looker Studio to calculate an average which we then assigned a colour code depending on its new average value.
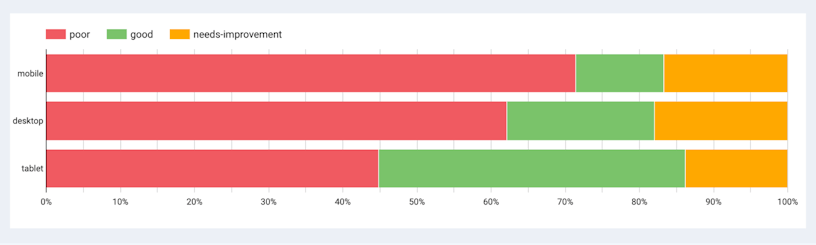
Stacked Bar Chart: We have divided our stacked bar chart by device, which gives us a nice overview as to how our website is performing overall for INP.
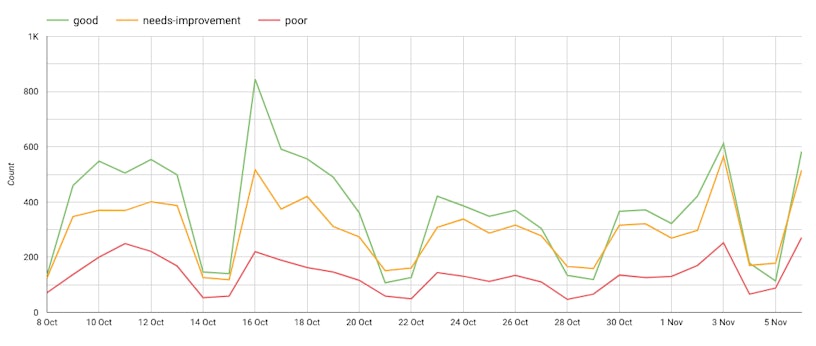
Line Graph: Lastly we have a line graph that allows us to look at the INP metric and its rating over time to determine if there are any specific timeframes where INP was better or worse. This is very useful when performing site-wide improvements and seeing how those improvements have affected ratings since then.
Looker Studio allows you to create your own reports like the above examples, don’t feel that you need to stick to the way we have chosen to measure these CWV metrics, feel free to take these learnings and adapt to your own reports that can be as detailed or simple as you require. We have provided a basic Looker Studio Web-Vitals template here.
Other methods of measuring INP include:
- Web Vitals Chrome Extension – To perform a live test of your page view’s CWV metrics.
- Google Search Console – To review your own website’s CWV metrics over time.
- Google PageSpeed Insights – To review CWV’s for a URL based on user and lab data.
- Lighthouse Timespan test from Chrome DevTools – With this tool you can run your own test on specific elements on your site, want to test the INP of a singular interaction? Run the test, perform the interaction and stop the test for reading on that one interaction.
What’s a good INP score?
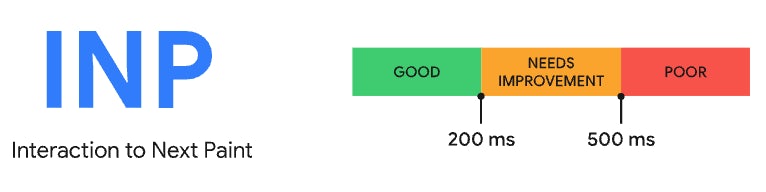
A good INP score is under 200ms, whilst a score between 200ms and 500ms is seen as in need of improvement and more than 500ms as poor.
It’s vital (get it, core web vitals?) to ensure that your pages are registering scores under 500ms at the minimum and to aim for under 200ms to ensure you’re meeting a good CWV score for your INP metric when it is introduced in March 2024. Now is the time to prepare and ensure you’re ready and potentially outperforming your competitors.
If you’re looking for help with reviewing and assessing your CWV’s or elements where your INP needs improvement you can utilise our technical SEO service to achieve this.


