
The purpose of blogs is often questioned – even in the most digitally savvy companies. Is blogging just about raising brand awareness and educating your target audience? Or can a company blog drive meaningful revenue?
Criticisms levelled at blogs abound in the C-suite. It is common to hear assertions that they are a waste of resource, and occasionally we encounter worries about giving away hard-earned industry knowledge through posts.
Such concerns come from a good place: those at the top naturally want to protect the company’s assets and the resource of its teams. However, any apprehensions can quickly be assuaged with the knowledge of what analytics platforms like Google Analytics 4 (GA4) can do to prove value.
To illustrate the purpose of a blog and convince key stakeholders of its impact, we first need a clear vision and goals. The most common reason for the failure of a company blog is lack of direction – and this can give rise to nervousness about pursuing blogging in the future. Far from being a case against this form of marketing activity, however, it simply highlights a need for data-driven strategy and robust reporting.
This guide first unpicks the ‘why’ behind blogs and the process of setting KPIs. It then shows how to demonstrate your blogging strategy’s contribution to the marketing funnel, from attracting qualified prospects to your site through to converting them into loyal customers. As you’ll soon see, it’s easy to showcase value with the help of GA4.
- What is the purpose of a blog?
- Content that converts
- Content that builds authority
- Content that earns links
- Establishing goals for your blog
- Visibility
- Sessions, engaged sessions, and engagement rate
- Conversion paths and click-throughs
- Revenue contribution
- Reporting on blog performance using GA4
- 1. Acquisition and engagement
- 2. Top-converting content
- 3. Traffic flow analysis
- Creating a path exploration report
- Creating a funnel exploration
- 4. Sales and revenue
- Drive value via your blog with Impression
What is the purpose of a blog?
The purpose of a blog is primarily to provide information: in this way, blogs satisfy potential customers’ queries and encourage them to take the next step, typically some form of conversion action.
Thinking beyond this simple definition, my experience as an SEO specialist has taught me that blogs are capable of achieving myriad business goals. The prevailing emphasis on ‘softer’, less measurable aims – educating customers, building trust, boosting brand awareness – explains why informational content is sometimes viewed as an unnecessary effort.
Instead, blogs should rightly be seen as an important building block in a holistic digital marketing strategy. As we’ll see, measurable, concrete objectives can be attained through blogging, and this can be demonstrated through the solid attribution tools available to us in GA4.
Content that converts
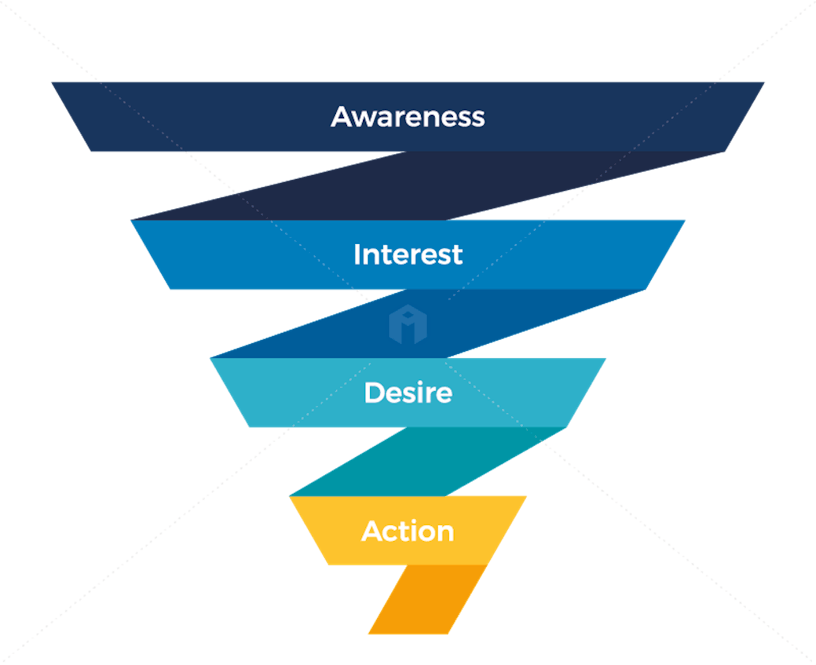
A full-funnel blogging strategy, informed by the AIDA model, is capable of bringing users on-site who would never otherwise have encountered your brand. These leads can then be nurtured through the creation of carefully thought-out user journeys that turn them into prospects and customers.
With a little analytics know-how, we can track how users progress through our intended journeys and report on whether they ultimately complete the desired goals.
Content that builds authority
As well as promoting conversions and link acquisition, high-quality blog content plays an important role in relation to E-E-A-T (experience, expertise, authority, and trust). Your approach to informational content should put these characteristics front and centre, positioning your business and its authors as experts with real-world experience of the topics you cover.
In doing so you’ll build topical authority, which confers site-wide ranking benefits: when search engines rank your blog content highly for informational terms on a particular subject, they’ll also view any semantically related pages more favourably in the ranking process. For example, if a site holds position one for the informational keyword ‘digital marketing glossary’, this will also help it to rank for associated commercial terms like ‘digital marketing agency’.
Take this into account as you develop a blogging calendar by planning topic clusters around your core product offerings. To measure the effectiveness of this approach, keep a close eye on organic rankings within the relevant product areas before and after the blog content starts to rank.

Content that earns links
You may already know about the role that backlinks play in SEO: search engines view each link to your site as a vote of confidence from the referring domain, in turn supporting the ability of your pages to rank. But fewer people are aware that blogs can be used to earn links naturally over time (and that, in fact, their posts may already be doing this without their knowledge).
Case in point, Impression’s evergreen guide on the differences between Bing and Google. First published in 2020 and updated on a regular basis since then, this post has earned natural links from over 130 referring domains including well-known, authoritative sites like Cambridge University Press and VentureBeat.
When Bing launched its new AI-powered experience back in February 2023, the search demand behind keywords relating to the search engine exploded in popularity. In turn, this resulted in a sudden spike in new referring domains as journalists and academics began linking to our blog as a useful citation:
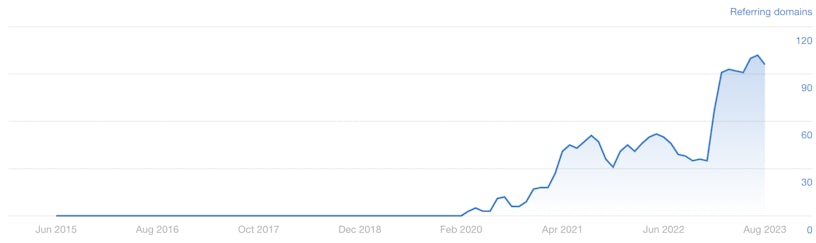
With only a small amount of work required for periodical updates, the post continues to earn backlinks and improve the site’s authority in addition to driving traffic and conversions. All of the gains that have been made across these metrics can be tracked and reported on using GA4, backlink monitoring software, and a custom-built dashboard.
Establishing goals for your blog
This brings us nicely onto the crux of the issue. Before you can showcase the value of your blogs using GA4, you first need to decide on their intended purpose and pin down exactly what ‘value’ looks like for your site. And as we’ve seen already, there’s a wealth of performance metrics for you to choose from.
When establishing a new blogging strategy, you could set any sort of goal(s) depending on the nature of the campaign and your business model:
- I’ve worked with software-as-a-service (SaaS) companies that publish content purely with the intention of increasing sign-ups for a trial.
- Ecommerce sites may look to drive sales through product-focused posts such as comparisons and buying guides.
- Lead generation sites commonly focus on downloadable content for data capture and future remarketing.
- All kinds of businesses use their expertise and in-house data to run thought leadership campaigns that earn natural backlinks over time.
Clearly, then, objectives will differ from team to team and from site to site. But whatever primary KPIs you settle on for your blogging strategy – and regardless of your company’s circumstances – the following data points should always be kept in view.
Visibility
Organic rankings are the natural precursor to performance in search; visibility therefore serves as the best leading indicator for the goals we look to achieve through blogging strategies. Whenever you publish content, take note of your target keywords and monitor your site’s positions using rank-tracking software.
Sessions, engaged sessions, and engagement rate
One of the top advancements of GA4 is its move towards engaged sessions as a new metric:
An engaged session is defined as a session that lasts longer than 10 seconds, has a conversion event, or has at least 2 pageviews or screenviews.
Reporting on overall sessions alongside those which resulted in engagement helps you to work out what kind of impact your blogs are having on readers. Based on this data, GA4 provides us with engagement rates for landing pages (the percentage of overall sessions that are engaged).
A lower-than-average engagement rate indicates a need to revisit content. You could be missing the mark completely when it comes to users’ expectations, or it might just be that you need a more compelling introduction.
Conversion paths and click-throughs
Once you’ve managed to engage your reader you can then encourage them to take an action, even if this is simply clicking through to another page.
Indeed, for some of my larger clients that have the advantage of fully fledged content operations, the main goal of a blog can be as laser-focused as generating click-throughs to a target page or group of pages. Once this has been achieved, the content specialist’s objectives are satisfied. It then falls to product teams and conversion rate optimisation experts to ensure users complete the desired action when they get there.
Whatever the size of your business or the aims of its content, though, there should always be a clear next step for the user to take after landing on one of your blogs. So unless you’re working on sign-up landing pages that mark the end of a micro journey, you should be keeping track of the URLs that users click through to after reading your content. Over time, this approach enables us to figure out common paths from blogs to conversions.
At Impression, for example, we know that our thought leadership content and technical how-to guides typically result in more users clicking through to service pages and submitting contact forms than other content types. This insight then informs the development of new strategies, allowing us to focus on content that’s statistically more likely to deliver on our marketing objectives.

Revenue contribution
The ultimate goal of any on-site activity is to generate revenue. But how can we calculate the financial contribution of a company blog?
For an ecommerce site, this could be as simple as totting up product sales from users who have landed on or viewed blogs before purchasing (more on how to achieve this in GA4 below). Other types of businesses may have to be a little smarter about how they calculate revenue – they could try measuring average customer lifetime value (CLV) and factoring in the historical probability of each marketing-qualified lead (MQL) becoming a customer.
Reporting on blog performance using GA4
And now for the technical part: reporting on blog performance using GA4. By far the easiest and most effective route is to create custom exploration reports.
Much like Google Looker Studio, exploration reports give you the freedom to build multiple tabs within the same interface, so you can create one report that acts as a single source of truth for all of the data you need. What’s more, the setup costs nothing.
The sections below outline the steps involved in making comprehensive reports that help you measure whether your blog is achieving its purpose and showcase value to key stakeholders.
1. Acquisition and engagement
If users aren’t landing on your pages and taking the time to consume your content, then there’s no chance of them moving on to complete sign-ups or purchases. So at the core of any worthwhile blog performance report you’ll find data pertaining to traffic and rates of engagement.
GA4 offers a plethora of metrics to choose from in this area. The exploration report below showcases the top ten posts on the Impression blog by organic sessions, with further context on the numbers of engaged sessions, views per session, and average session durations. The same information could also be displayed in a custom report in GA4.
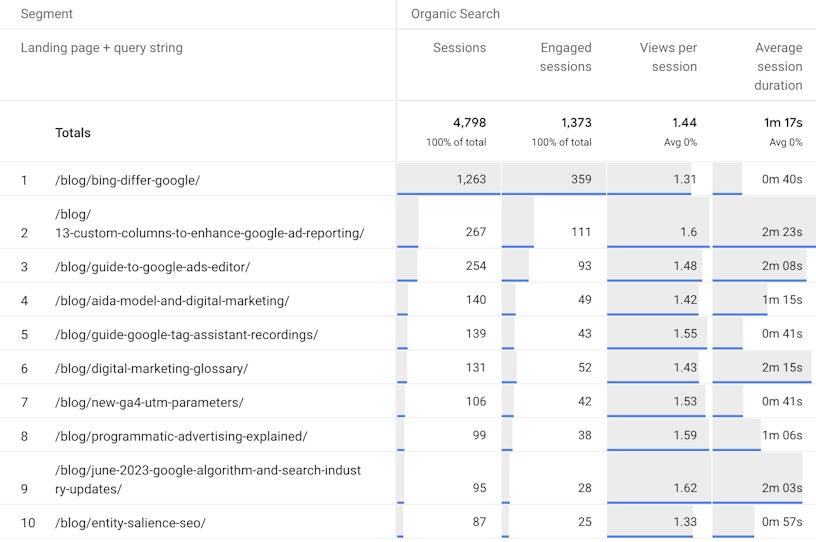
From this table, we can not only gauge where our engaged organic traffic is coming from, but also glean top-level insights on how our intended user journeys are performing: Which articles lend themselves towards longer sessions with more pages viewed? Are certain types of content doing a better job than others at encouraging users to stay on-site and take the next step?
You can create an acquisition and engagement report for your blog by following these steps:
- Create a new Blank exploration report with the segment set to organic if this is the channel you’re interested in (the Source Medium should contain ‘Organic Search’).
- Choose ‘Landing page + query string’ as the dimension, adding sessions, engaged sessions, views per session, and average session duration as metrics.
- Pull these dimensions and metrics into the table by clicking on them in the lefthand Variables panel.
- At the bottom of the Settings panel, filter Landing page + query string so that only URLs including your site’s blog subfolder are featured.
2. Top-converting content
The above report provides useful information about which blogs are bringing prospects onto the site, grabbing their attention, and generating clicks through to other pages. But what about the rest of the journey – and the conversion actions we’re trying to guide users towards? This is where a top-converting content report becomes essential.
There are several possible routes to creating a conversion report for your company blog. The option I’ll walk through here attributes value to any blog that a converting user interacted with, whether they entered the site by clicking through to the post from organic search results or simply viewed it.
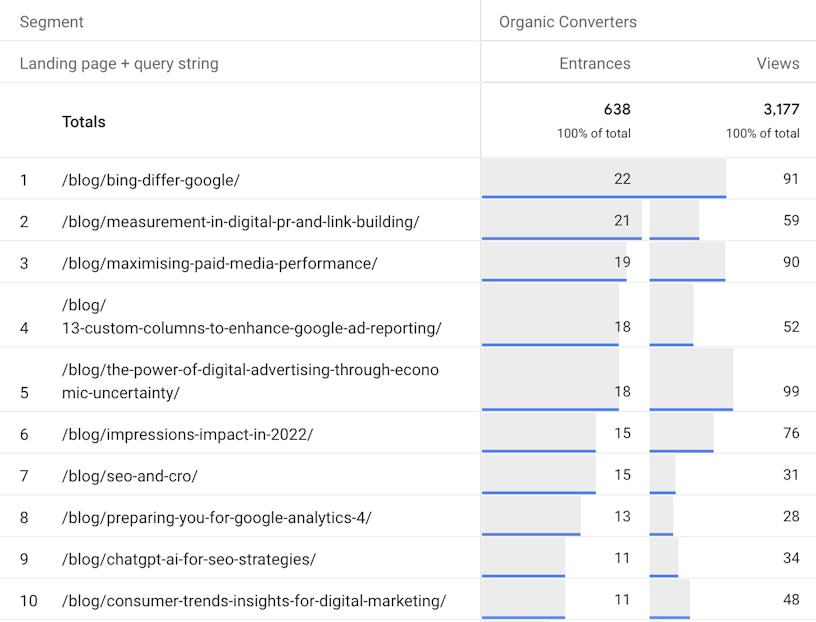
The entrances column highlights how many landings each blog received from a segment containing only users who converted in the same session (in this case, they submitted a contact form on our site); to the right of this, the views column indicates how many page views each blog received from the same ‘Organic Converters’ user segment.
A report such as this gives us a vital steer on the types of content that not only attract organic traffic, but also contribute to conversions. Whilst the version we have set up for the Impression site focuses on lead generation, you could also modify your user segment to include those who purchased an item on an ecommerce site – or, for that matter, any other conversion event that you have set up.
Follow this process to create your blog’s top-converting content report:
- Add a new tab to your existing blog performance exploration report entitled ‘Top-converting content’.
- Create a new user segment called ‘Organic converters’ – this should only include users when their Source Medium contains ‘Organic Search’ AND the event_count of your chosen conversion(s) is greater than 0.
- Choose ‘Landing page + query string’ as the dimension along with entrances and views as the metrics; select these in the Variables panel, adding them to your new table.
- In the lower part of the Settings panel, apply a ‘Landing page + query string’ filter to display only URLs that contain the subdirectory of your site’s blog.
Note: When creating the user segment, leave organic out if you’d like to see performance across all channels – and change the condition scoping to ‘Within the same session’ if you only want to include conversions that happened during the same session as the blog interaction.
3. Traffic flow analysis
By now, our blog performance report is capable of giving us an abundance of useful insights into which posts attract organic traffic, engage users, and promote conversions.
This information in itself demonstrates value; it also allows us to concentrate our future strategies on ‘money content’, honing in on themes and formats that have helped us to deliver results previously. But we can take things one step further.
Traffic flow analysis enables us to work out which specific pages or subfolders users visit next after landing on our site, which can be invaluable if the purpose of a blog campaign is to encourage users to click through to a chosen product or service page.
Top tip: to analyse whether users are following specific journeys between pages, a path exploration report is the right technique; for top-level insights about which sections of the site users visit after landing on blogs, use a funnel exploration with a trended funnel visualisation.
Creating a path exploration report
In the report below, the middle column entitled ‘Step +1’ shows how many users landed on each page from organic search. If we then click on one of these pages, a second set of titles appears to the right in the ‘Step +2’ column, indicating which pages users visited next after landing on the page.
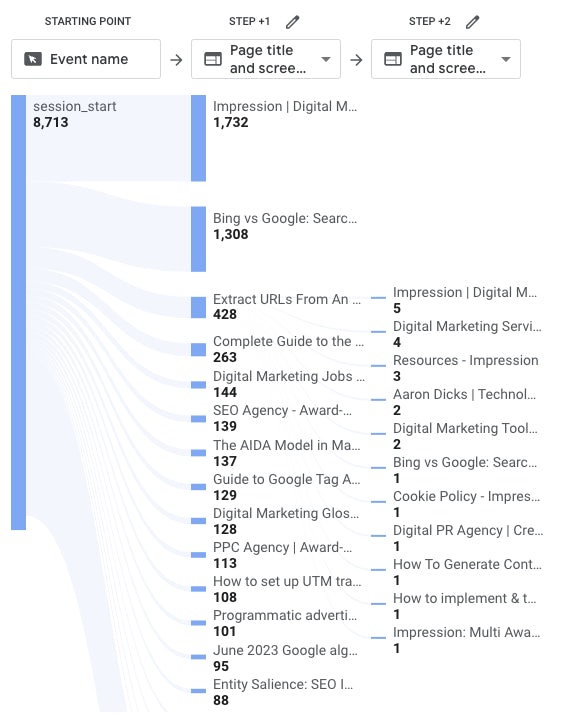
Here, we see an array of pages that users initially landed on, from the homepage at the top of the central column through to our guide on entity salience in SEO at the bottom. In this case, I’ve opted to click on the page entitled ‘Extract URLS from an XML Sitemap’ (a free tool offered by Impression). This then brings up the third column to the right, containing the next pages that users visited on their journey after landing on the sitemap extraction tool.
A path exploration report such as this is particularly handy in assessing whether users are following the desired journey we had in mind for them after they landed on a particular blog. Insights taken from here can help us to optimise the use of internal linking and CTAs on individual posts – or even prompt us to reconsider the intended user journey altogether if it isn’t working out in practice.
To create your own path exploration, simply:
- Create a new report using the Path exploration template.
- Apply an organic segment if you’d like to explore this channel on its own (the Session Default Channel Group should contain ‘Organic Search’).
- Open the drop-down menu under ‘Step +1’ and select ‘Page title and screen name’.
- From here, you can click on any landing page title in the first column and the interface will open a second column highlighting where users clicked through to next (you can follow the same process to investigate further clicks beyond this point if needed).
Creating a funnel exploration
We can unlock micro-level insights about individual user journeys with a path exploration template, yet sometimes we might want to see the bigger picture. For example, you may be looking to track the percentage of users who click through from all blogs (or a group of blogs) to commercial subfolders. A funnel exploration report with a trended funnel visualisation is the best option.
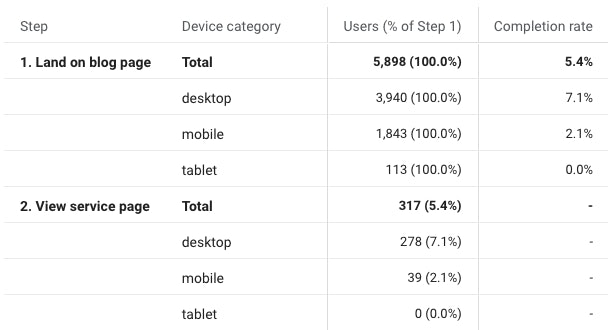
Having set up this report for the Impression site, we can see that 5,898 users have landed on our blog posts in the selected timeframe – 317 (5.4%) of these users then went on to view a service page, which is most often the desired next step in the journeys we create.
The data is then broken down by device category for further insight. In this case, our report highlights that we see click-throughs much more frequently on desktop than mobile or tablet (other useful breakdown options include gender, country, and traffic medium).

Making a funnel exploration report for your own site is easy:
- Create a new Funnel exploration report and set the visualisation to Trended funnel.
- If you’d like to see organic traffic in isolation, create an organic segment (Source Medium contains ‘organic’).
- Set up two ‘Steps’ in the Settings panel – step one should narrow the Landing page + query string down to your blog subfolder or a group of blog URLs as required, and step two should focus on page views for your commercial subfolder(s).
- Apply the Steps, then select any additional breakdowns you’d like to see in the Settings panel.
4. Sales and revenue
There’s no one-size-fits-all approach to reporting on the sales and revenue contribution of a company blog. To help you plan out your report, ask yourself these key questions:
- What do your conversions look like? Are you looking to generate leads, sell products, or encourage sign-ups?
- How can you assign value to each of these conversions? (For products, straightforward ecommerce revenue fits the bill, but other business models might demand a little more creativity.)
Let’s kick off with an easy example – reporting on the revenue generated by a series of buying guides. Similar to the approach we took with top-converting content, we first need to create a custom segment that contains only users who have landed on or read one of the guides:
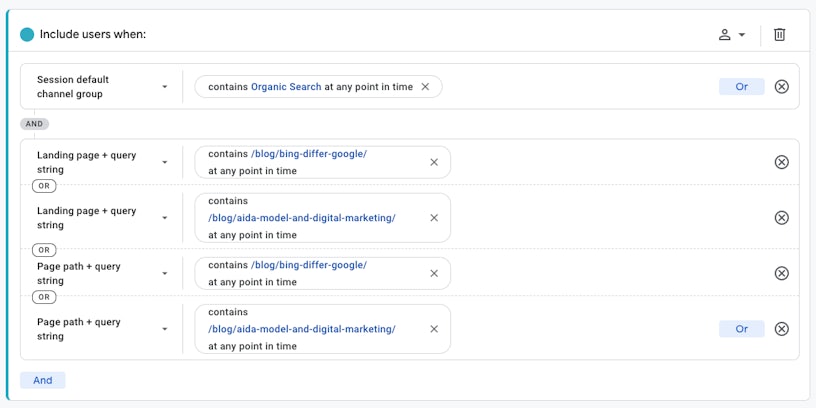
- When defining your segment, include conditions for each of the guide pages you’re interested in or use regex to define a group.
- To narrow the segment down to only users who have landed on the relevant guide(s), use ‘Landing page + query string contains [URL]’.
- If you’d like to also include users who have read them as part of the session in which they converted, this can be achieved by adding ‘Page path + query string contains [URL]’ and changing the condition scoping to ‘Within the same session’.
- You may find it useful to create two separate segments for converting users who landed on blogs and users who viewed them in the same session they converted.
As the Impression site has no ecommerce function and we’re focused on generating leads, our version of the report just contains metrics like conversions and conversion rate for a specific group of blogs. We can then assign a rough average value to each conversion based on historical data or use some clever CRM integration to get more exact figures.
If your site sells products, simply switch out form fills for the ecommerce metrics you’re interested in. Given the custom-built nature of exploration reports, you can include whichever insights might prove useful for your stakeholders – anything from simple revenue and purchase numbers through to data on how customers are progressing along the checkout funnel after reading your guides.
Drive value via your blog with Impression
This guide has shown how to articulate the purpose of your blog, set clear goals, and showcase value using GA4. As a multi-award-winning digital agency with diverse specialisms across content SEO and analytics, Impression can help you up your game when it comes to informational content and reporting. Speak to our team today.


