- What is Google Data Studio?
- Google Data Studio history
- About Connectors and Google Apps Scripts
- Example use: pulling live keyword ranking data into Google Data Studio
- How to create a Google Data Studio Community Connector
- Setting up a new Google Apps Script for the Connector
- Default file layouts and function calls
- Connector application design
- Testing
- Deploying a custom Data Studio Connector
- Questions?
- Full code example
What is Google Data Studio?
Google Data Studio is a data dashboard and reporting tool which provides easy-to-read, shareable and customisable reports from a variety of data sources.
Data Studio is now free to use and can produce reports from almost any online data source; including digital marketing analytics, CRM pipelines, YouTube stats, etc.
You can browse a gallery on Google’s site here, or read on to skip to the good stuff!
Google Data Studio history
In May 2016, Google announced Data Studio would be accessible for users who are not subscribed to the Google Analytics 360 Suite. The product initially launched with a limited number of reports per account and a limited number of data connectors. But, since February 2017’s announcement, the tool has been unlimited and free for all users. In March, Google finally launched it worldwide and the product has been improving ever since (see changelog).
Initially, Google Data Studio launched with connectors for Google-only services (including Google Cloud), as well as a few more general purpose Data Sources, such as File Upload and MySQL. Then, in September 2017, the Data Studio “Community Connectors” developer programme launched with around 200 community-driven connectors from around 10 providers.
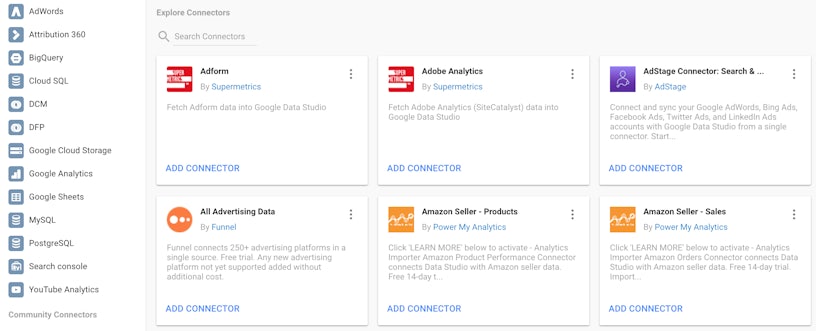
Not only did this make the platform infinitely more useful for cross-channel marketers (popular providers like Supermetrics got in there; below) but this has also opened up the opportunities for in-house and in-agency developers to build and deploy their own connectors. And that’s exactly what we did here at Impression:
Has anyone seen live @getSTAT data in Google #DataStudio
We have ? @impressiontalk pic.twitter.com/CVtV41RN6T
— Aaron Dicks (@aarondicks) October 24, 2017
About Connectors and Google Apps Scripts
Community Connectors can be built by almost anyone with experience in JavaScript and using Google Apps Script. The documentation is reasonably thorough despite the program being in its early days; you can certainly get up and running with the existing docs.
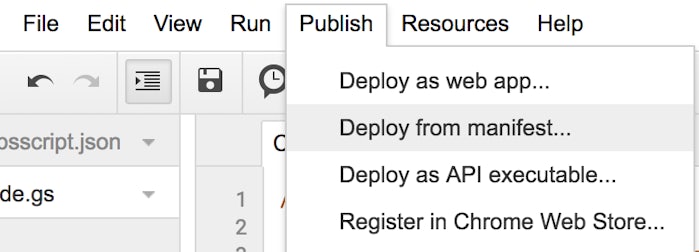
To become a Google Data Studio Community Connector developer, you need to request to be whitelisted to see extra features in your Google Scripts account. You can send this request here. You’ll know you have access as you also get an invite into a Google Group for developers and your Scripts ‘Publish’ menu will now have this option:
For those familiar with the Google Apps Script IDE, you’re in luck as all the usual Apps Scripts are available for use here.
Beware that whitelisting your account can take “2-4” working days. In reality, I was whitelisted in a little over a day.
Example use: pulling live keyword ranking data into Google Data Studio
Our demo below is far from complete, but it’s enough to give a good demonstration of what’s possible with Data Studio connectors. It actually only took a few hours to set up and it’s safe to say we’ll be working on this a lot more in the coming weeks.
There are a number of elements that this tutorial will not cover, including date ranges, OAuth authentication/connectivity and data caching. These topics will be covered in a future follow up post, or in the comments below.
Our enterprise search engine rank tracking data provider, STAT, provides a really open API that allows us to pull all keywords that we’re tracking for a specific site. Currently, among all Community Connectors, there are only a few entry-level packages that do the same, so we were keen to plug in the enterprise level data for our clients.
It doesn’t allow for date-specific searching, hence this tutorial not covering that requirement, but we know of a couple other agencies circumventing this by caching the data in SQL databases and then using the SQL connector to get the data that way.
How to create a Google Data Studio Community Connector
As Google’s documentation simply puts it, there are three steps to creating a community connector;
- Create a new Apps Script project.
- Write the connector code.
- Complete the project manifest.
I don’t disagree with this sentiment, but it’s not entirely that simple…
Setting up a new Google Apps Script for the Connector
No special settings are required in order to start scripting. However, you will need a whitelisted developer account to test deploy your work. In the interim, you can use the standard debugging tools and spoof requests to your getData() function to check that the data is properly formed. I’ve covered how we tackled this in the Testing and Deployment section below.
If you can already create a manifest document, do so now, otherwise refer back to this once you’re whitelisted. This is required to deploy the Script later on. You can view your Scripts manifest by clicking:
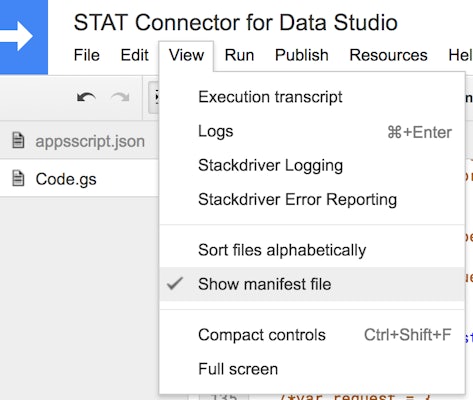
The full manifest file specification can be found here; otherwise please feel free to repurpose the example in my code below.
Default file layouts and function calls
The Community Connector developer program documentation gives a good amount of information on this. From this page, copy across the shell functions and the schema variable that I’ve listed below or dive straight into the sample project we’ve developed at the bottom of this post.
Functions
- getConfig (request) {}
- getSchema (request) {}
- getData (request) {}
- getAuthType () {}
Variables
- Schema or “fixedSchema” in the documentation
Assuming that you aren’t yet using OAuth and you’re comfortable reading code samples (Google’s or mine below) then I will focus on the getData() function here.
This function, if not implemented properly, can result in errors for a number of reasons. I was tripped up by the header field order not matching my rows and the varying row length (different queries can result in a different number of metrics being required).
The most important part of this function is to return a properly formed object:
var return_data = {

schema: headers,

rows: rows,

};
The schema argument expects an array of Field objects. If in the request, the fields array appears in a different order to your defined schema (for example metrics can be reordered), then you must refer to this array and reorder it. If any metric is not requested in the request.fields array, then it should be excluded from the reordered return array.
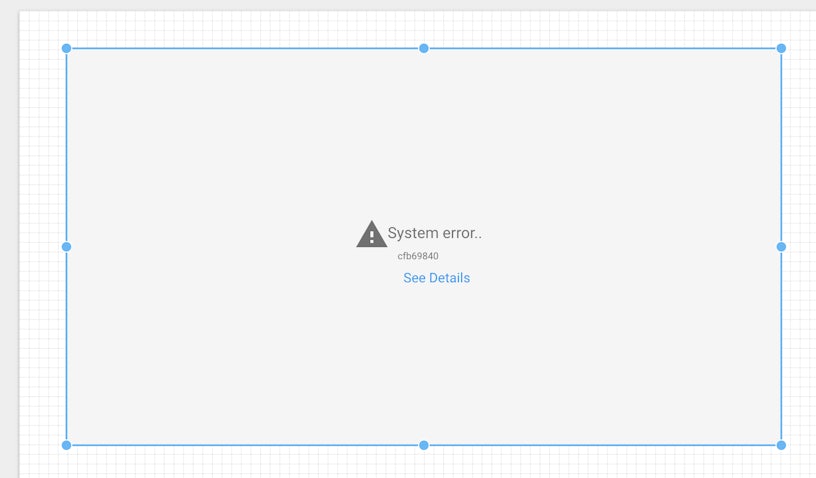
Similarly, the rows must be formatted correctly to prevent errors. The required format is an array of objects; one per row. Within this object, the values parameter is an array of the requested field values. A properly formatted example of this is below, along with an error page example.
rows=[{values=[ab split testing, 50, 101.0]}, {values=[ab testing, 1900, 101.0]}, {values=[bing ads management, 30, 8]}];
Connector application design
When you’re designing your own Community Connector you’ll need to be mindful of the dimensions and metrics you’re looking to present. This will fit into your schema and will then be presented like so on the controls sidebar.
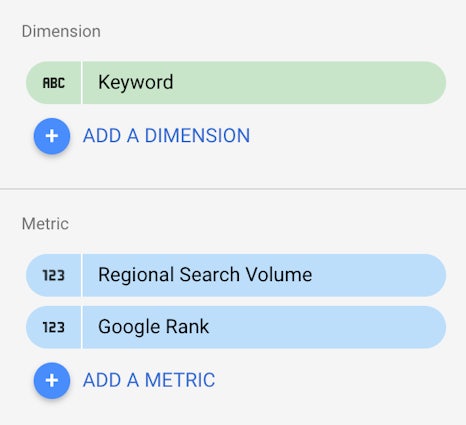
I always like to think of dimensions not as metrics, but ways to segment your data (location, city name, keyword, colour, etc). Metrics are the facts which you are tying to your dimensions and these can usually be filtered. This principle of metrics and dimensions is exactly the same as within Google Analytics.
If your connector allows multiple dimensions and multiple metrics, for use across a number of the graph and chart types on offer in Data Studio, then you should be more wary of error handling within your application. Google provides more information on error handling here.
Testing
To test our getData(request) function in advance, we constructed a sample request object from the documentation and later refined this when we had access. If you consider this is based on your configuration, you can take the below to represent a sample query for yourself. The configParams object contains the data your user enters when they install the Data Connector. The fields array includes a named reference to your Schema object — the fields here (dimensions and metrics) are in order as per your user’s selection.
var request = {

configParams:{

apiKey:'12345',

siteName:'impression',

siteId:'666'

},

fields:[

{name:'keyword'},

{name:'regionalSearchVolume'},

{name:'googleRank'}

]

};
Once you’ve got access to deploying your connector to Data Studio, I found the StackDriver logging invaluable. In the place of the Logger class, you’ll want to use the Console class so that the debug content is passed to StackDriver.
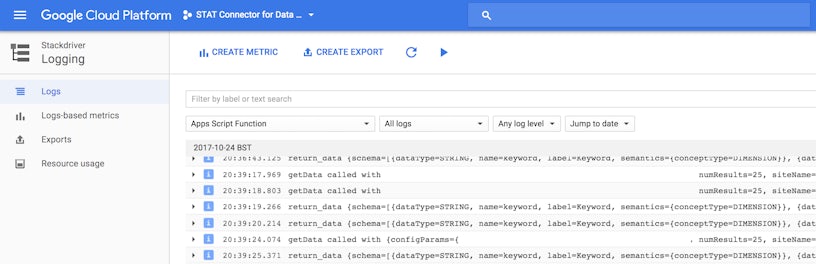
You can actually expand out each line item here, to view the JSON payload and dig a little deeper. Errors are also shown in here, too, and they look like so;
![]()
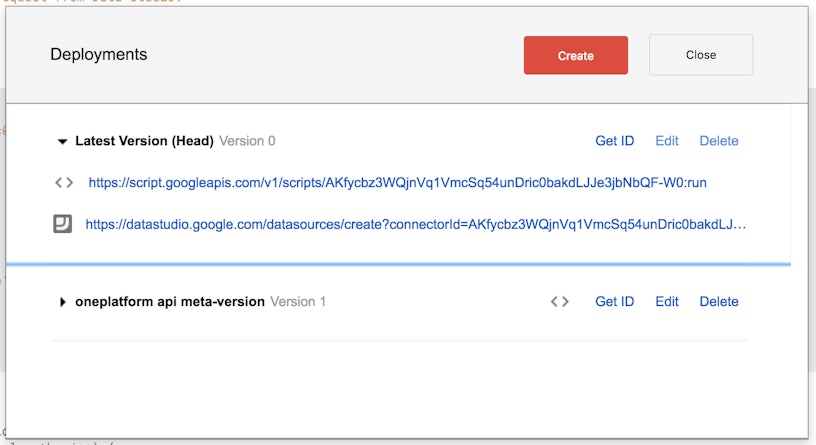
Deploying a custom Data Studio Connector
The process of deploying the connector is straightforward. Click Publish > Deploy and then find and click on the Data Studio URL.
This will open a new window and add the data source to your Data Studio account. Here, you can enter any required information and add it to a report. You can also take this opportunity to share the Data Source with colleagues.
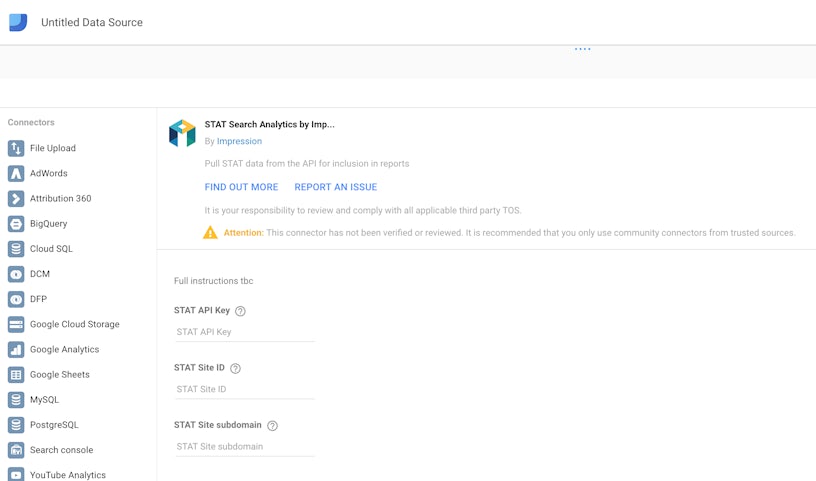
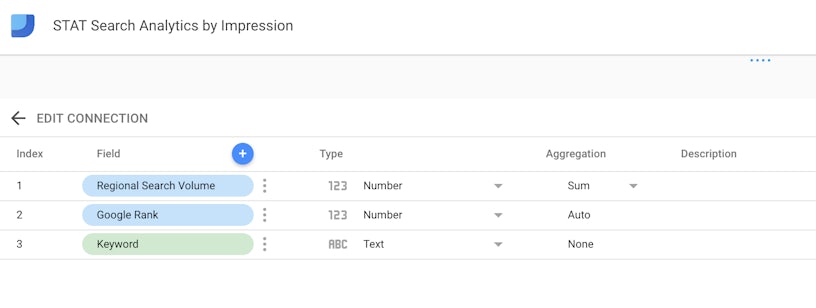
Once you’ve added the data source, you have an opportunity to confirm you’re happy with the settings for your fields. You can use this to trial the impact of any schema changes, such as the aggregation settings.
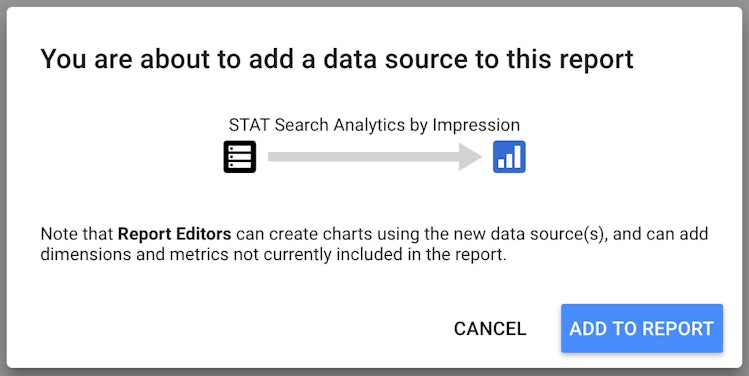
Finally, once on your report canvas, you’ll be asked one final time to confirm that you’re happy to add the new Data Source to your report. Following this, you’re free to select a graph/chart and begin using the data.
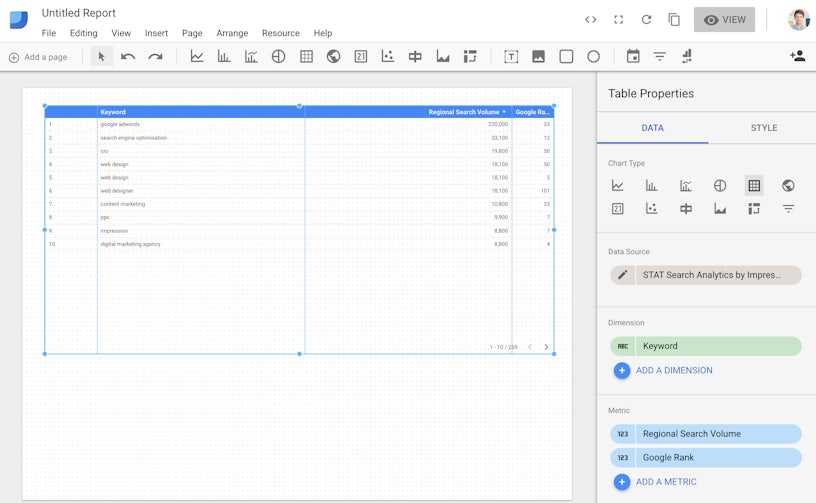
A table is the most appropriate display of the data my example is showing. You can see here that I’ve selected two metrics, Google Rank and Regional Search Volume, and that they’re being shown in this order in the table. As the data is now read into Data Studio, the Sort and Filter settings work as expected without additional API calls.
Questions?
I’d be more than happy to take a look at them in the comments below! Please feel free to post code snippets or links to hosted code gists or similar. We’re interested to see what you’re achieving with Data Studio Connectors. Good luck!


