Find the full transcription of this video below
Introduction
If there’s one thing that the COVID 19 pandemic reminded the SEO industry of is that search volume isn’t a static metric. It’s dynamic, and with each month of the year that passes by, it can vary massively according to seasonality, market trends, and other external factors at play. In this video, I’m going to show you how you can use search volume’s dynamic nature to your strategic advantage, allowing you to focus your resources on topics with an increase in demand rather than those that are facing a decreasing demand.
Locating ‘Search Volumes’ in SEOmonitor
Finding search volume trend data within SEOmonitor’s UI is really simple. So, we can find this at campaign level here, in the same place once we drill down to folder level, then the same again once we drill down to group level. If you wanted to expand this dataset, you just click on this explainer icon, then this side panel will appear.
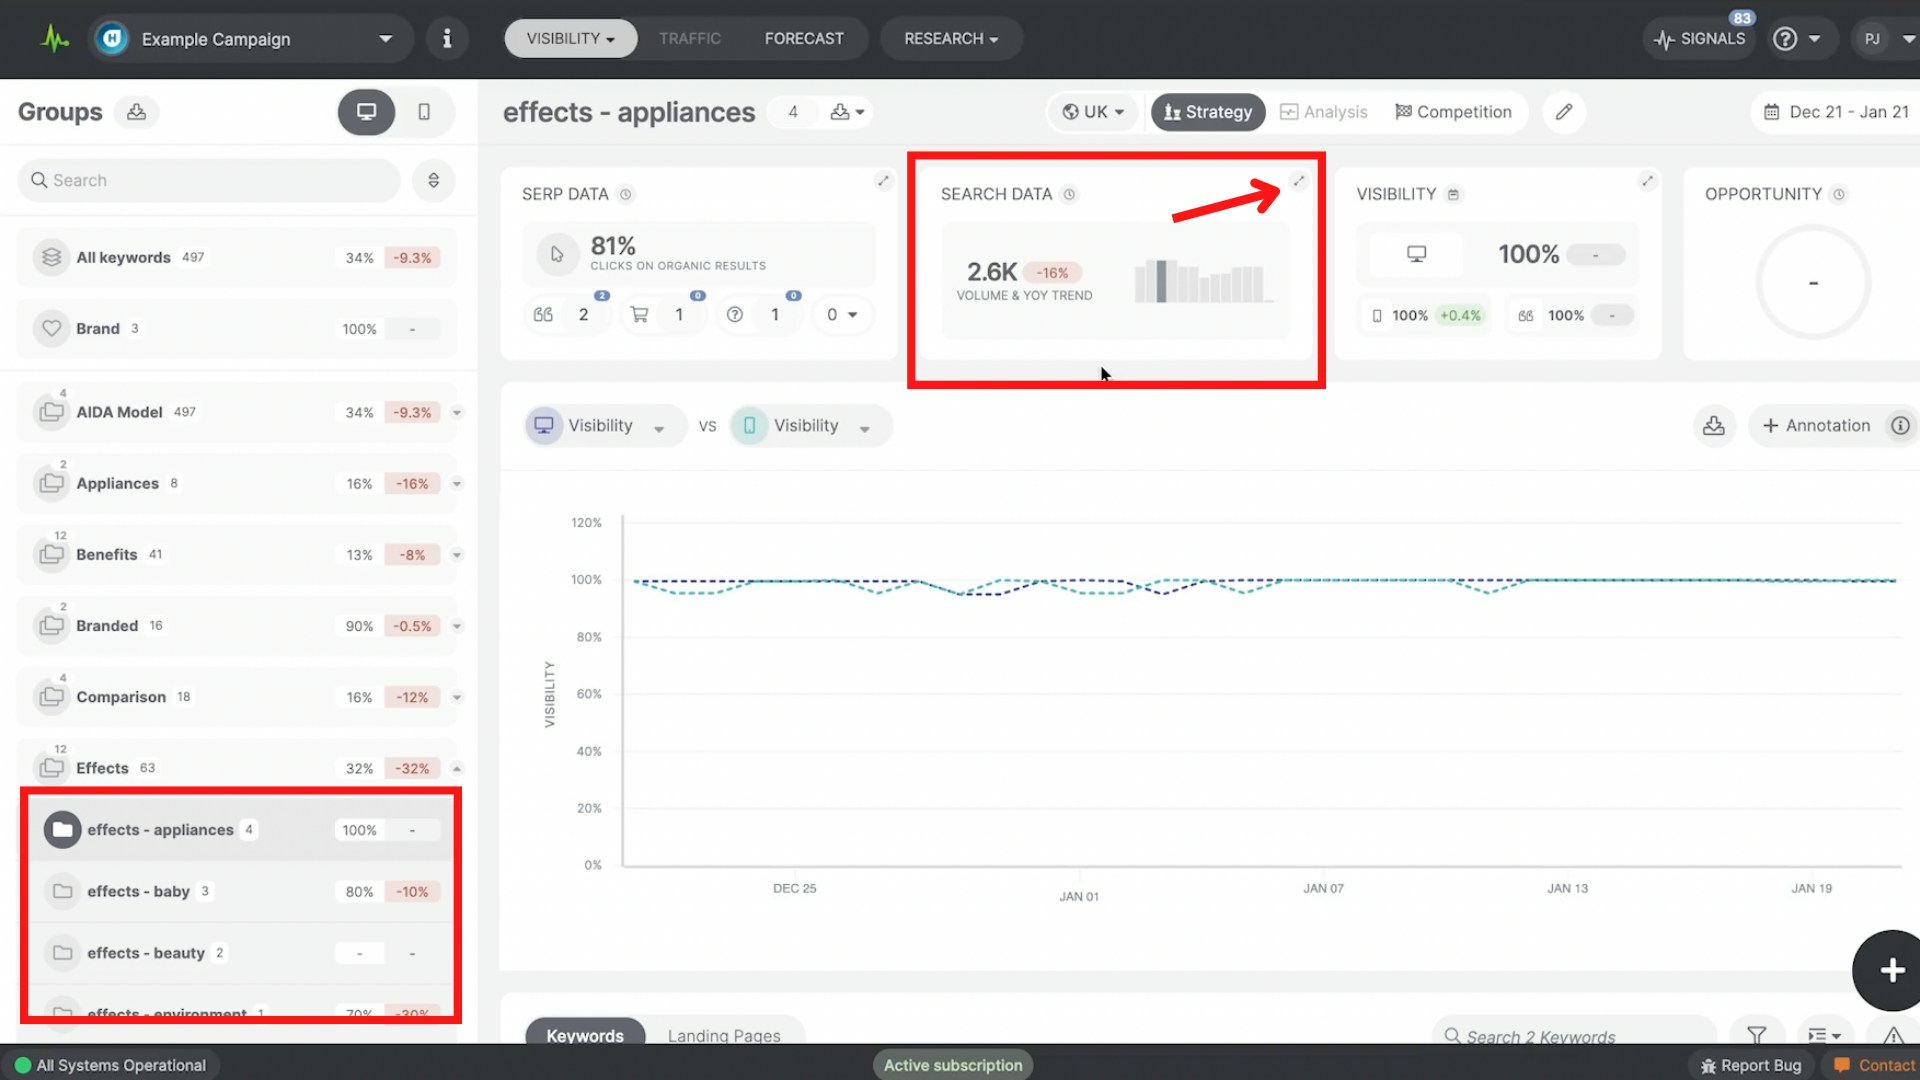
Search volume insights are then also available at a keyword level, and it’s here that we can immediately start to see why this data is so useful as it provides additional context to performance insights.
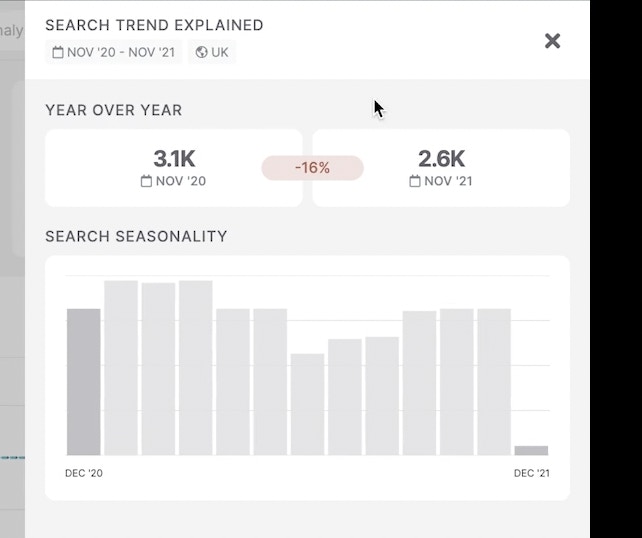
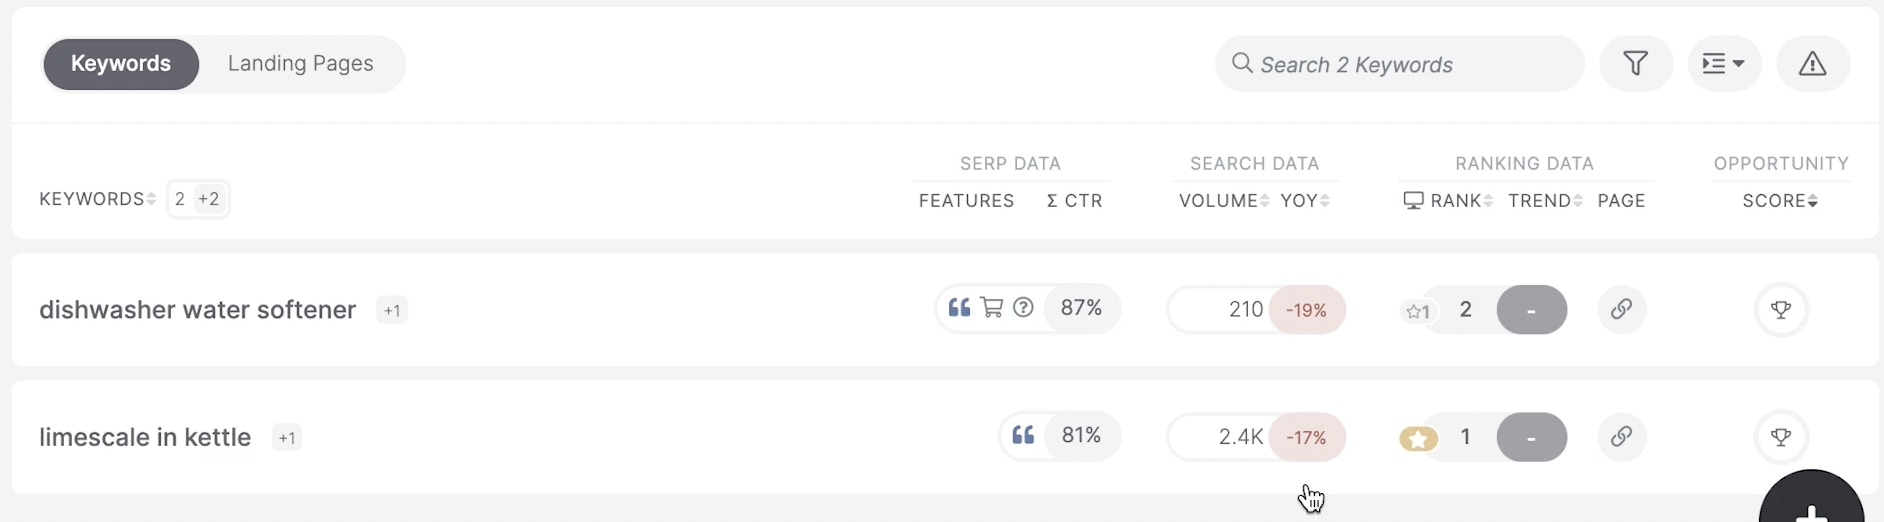
Let’s stay focused on this group. So we’re looking at the effects of softened water on household appliances. So this is an informational topic that’s closely related to this business’s core product offering and it’s something that we’ve captured as a larger part of their content strategy. So here, although we’re well placed for clicks, ranking, position two and position one respectively for these terms, we can see that the search volume insights are telling a different story. So search volume actually decreased by minus 19% and minus 17% respectively.
So though at first we theorise we’re in a good position to receive clicks due to the ranking position, the search volume data is almost working against us. It’s just that, let’s say the ranks have stayed the same annually. We’d be achieving less acquisition year on year purely due to the diminishing audience behaviour that’s at play.
So then, as a next step, it can be interesting to cross reference this data, say with SEOmonitor’s traffic module, also, perhaps Google Analytics or Google Search Console, to determine how clicks have been affected annually to validate our search volume insights.
Using advanced filters with search volume trends
Okay, an awesome feature of SEOmonitor’s search volume trend data is that it’s also filterable. We can cross reference this search volume data, let’s say, with rank data to find great low hanging fruit opportunities. You might refer to these as cusp keywords or those within striking distance. So what I’ll do now is set up a quick filter to show you what I mean. So if we head over to the filter options, let’s say I want to find all keywords within this campaign that rank on the top half of page two. So I’ll use this latest desktop rank filter and the first half of that will be capturing keywords that rank below position 10.
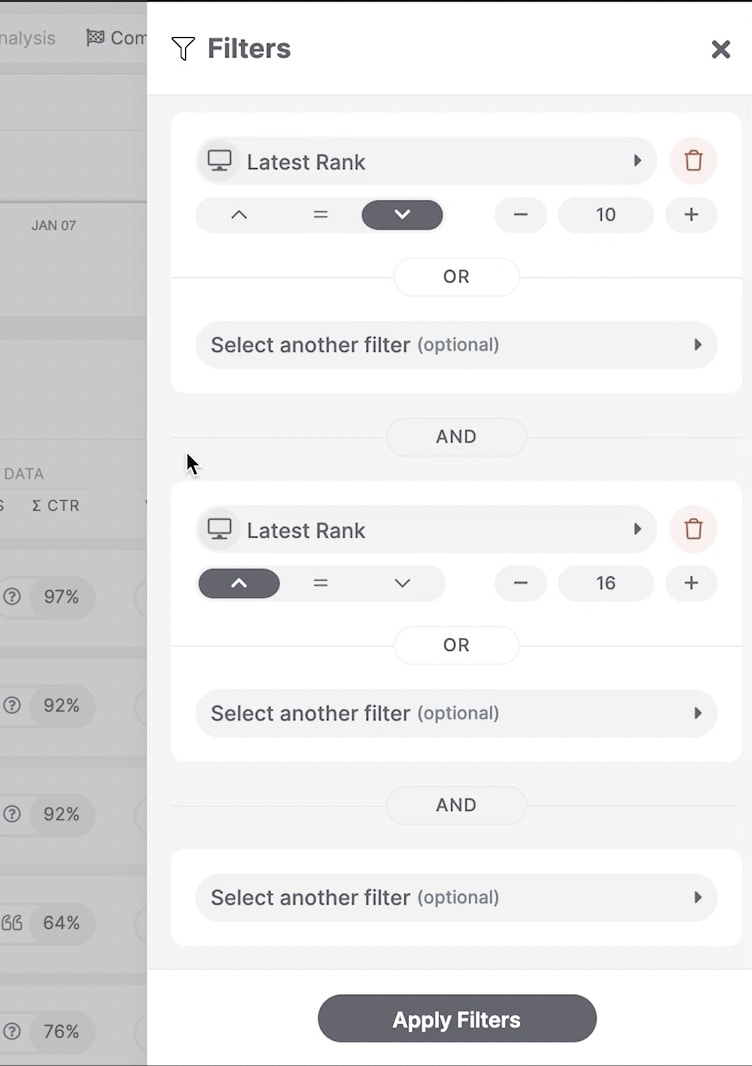
Then I also want to couple it with the same filter, but this time capture the other side of it. So keywords ranking above position 16. Now, of course, I appreciate that within the modern SEO landscape, SERPs don’t always fit into the neat, 10 links per page. But for the purpose of this example, let’s just presume, positions 11 to 15 does kind of encapsulate the top half of page two.
So I’ve got my ranking distribution filter setup. Let’s now just finalise this with the search volume trend data. So it’s this one here, ‘Year-over-Year’ search trend.
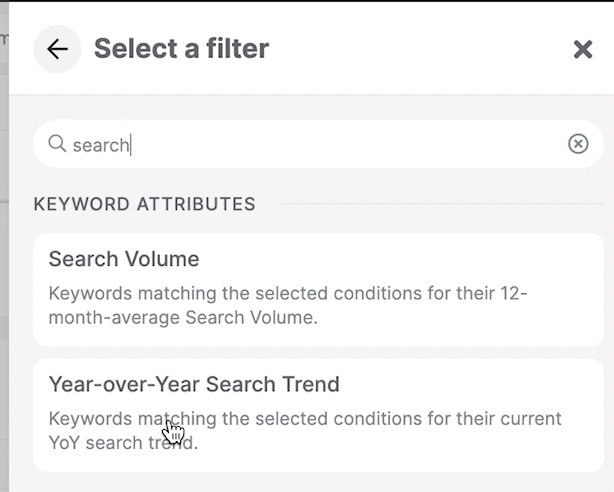
And what I want to do is refine this list further by capturing keywords that have only increased in demand. And let’s say by a threshold of greater than 5%.
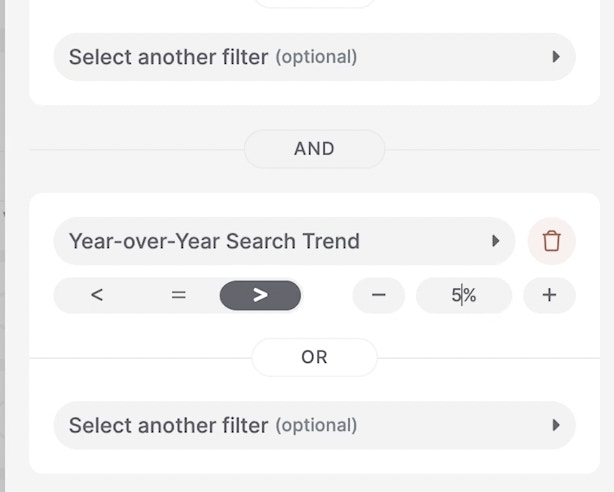
So once I apply these filters, SEOmonitor will then provide me with this cross section. You can see here all the keywords that have increased by at least greater than 5%.
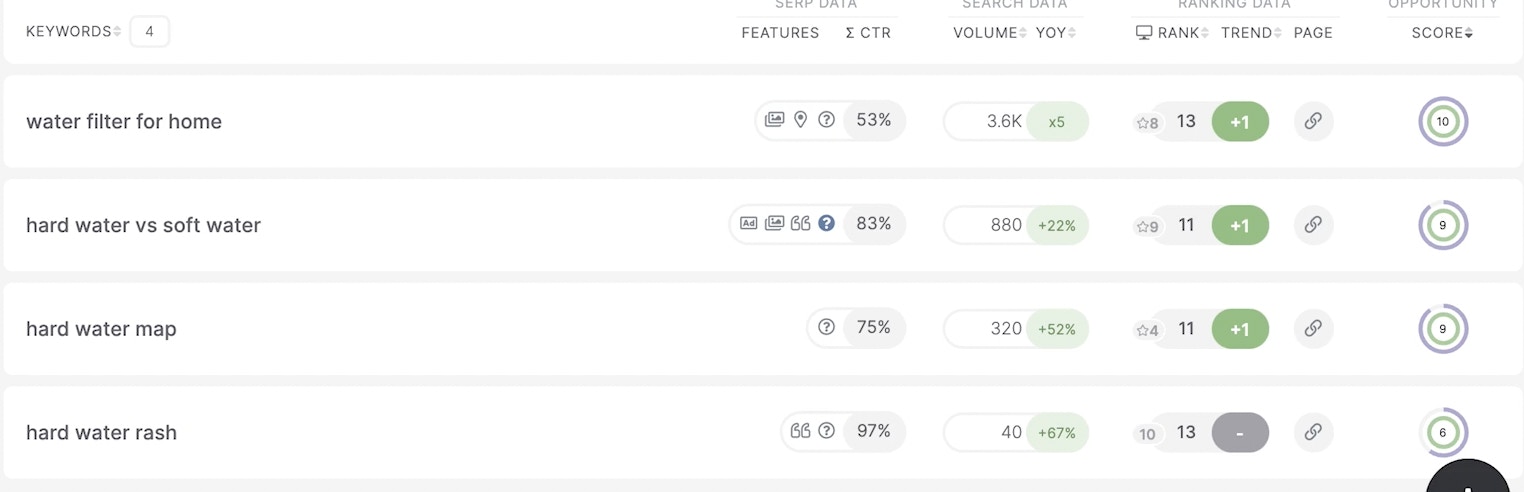
So ‘water filter for home’, lets say, straight off the bat is a great example here of an exploding topic. It’s increased by five times a year-on-year and we’ve also almost secured page one visibility for it. So ranking position 13 on desktop and 16 on mobile.
So I can then use this insight when speaking to relevant stakeholders, say in order to communicate further content opportunities, to merge this topic or other topics further towards page one or even where relevant. Use this as ammunition to communicate further product investment opportunities, say when I’m speaking to product managers.
Reporting on branded search volume
As SEOs, sometimes we can be fine tuned to only review non-branded opportunities but we can also apply SEOmonitor’s search volume trend data to branded search as well.
This is especially handy when working across multi-channel campaigns with other digital teams, say perhaps in PR or paid media, or even across above the line activity where such strategies can indirectly influence your brand search volume.
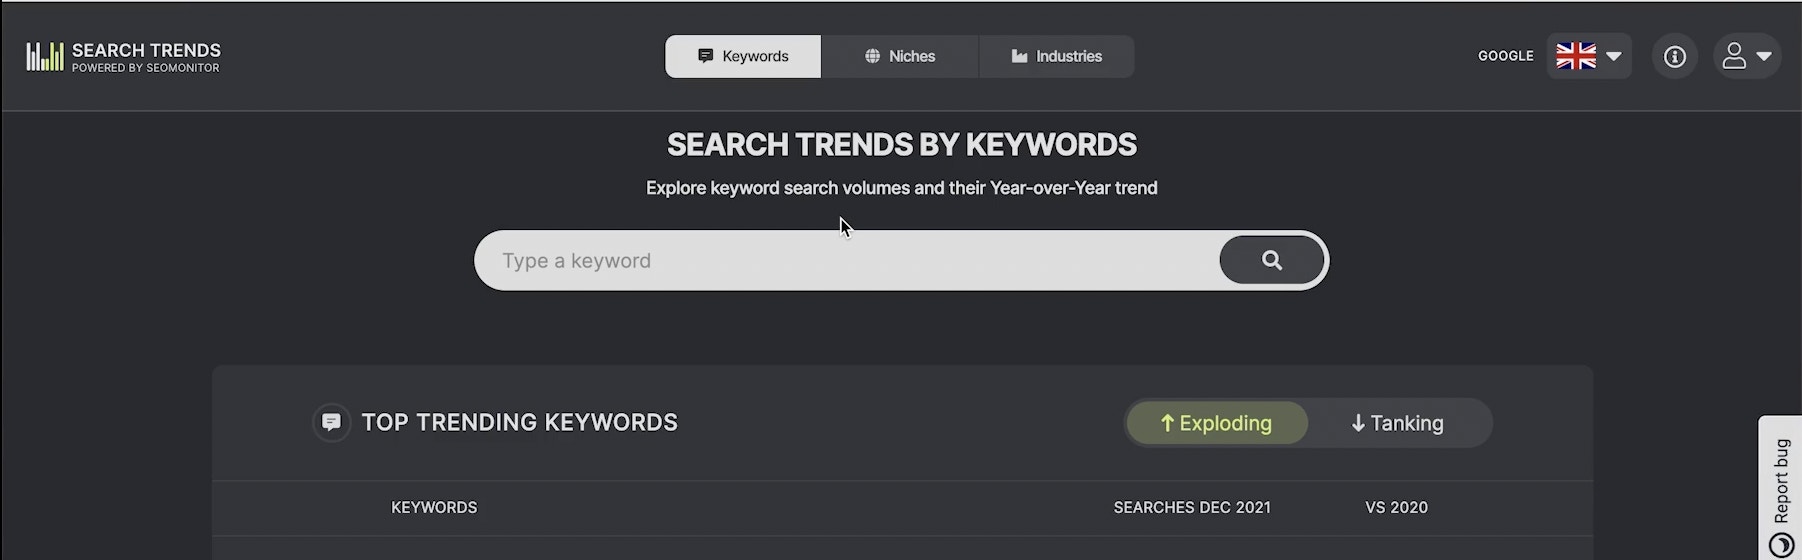
Here tracking brand search volume can be an important KPI to report on and everything we’ve seen within this video applies as much to branded search as it does to non-branded search. Now you can find the brand data via this group here and as we know this is something you can configure during the setup of your campaign. But also don’t forget to check out SEOmonitor’s trend tool, which you can find underneath research here.
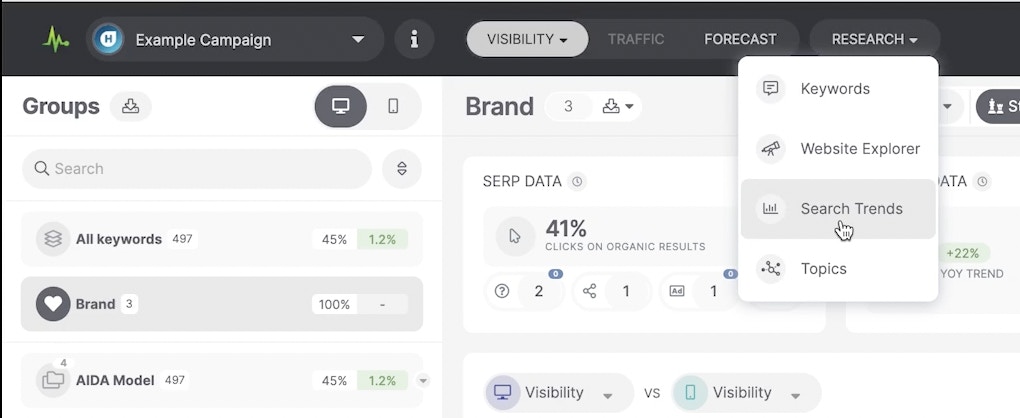
And by clicking on search trends, it’ll open the tool in a separate tab. Here.
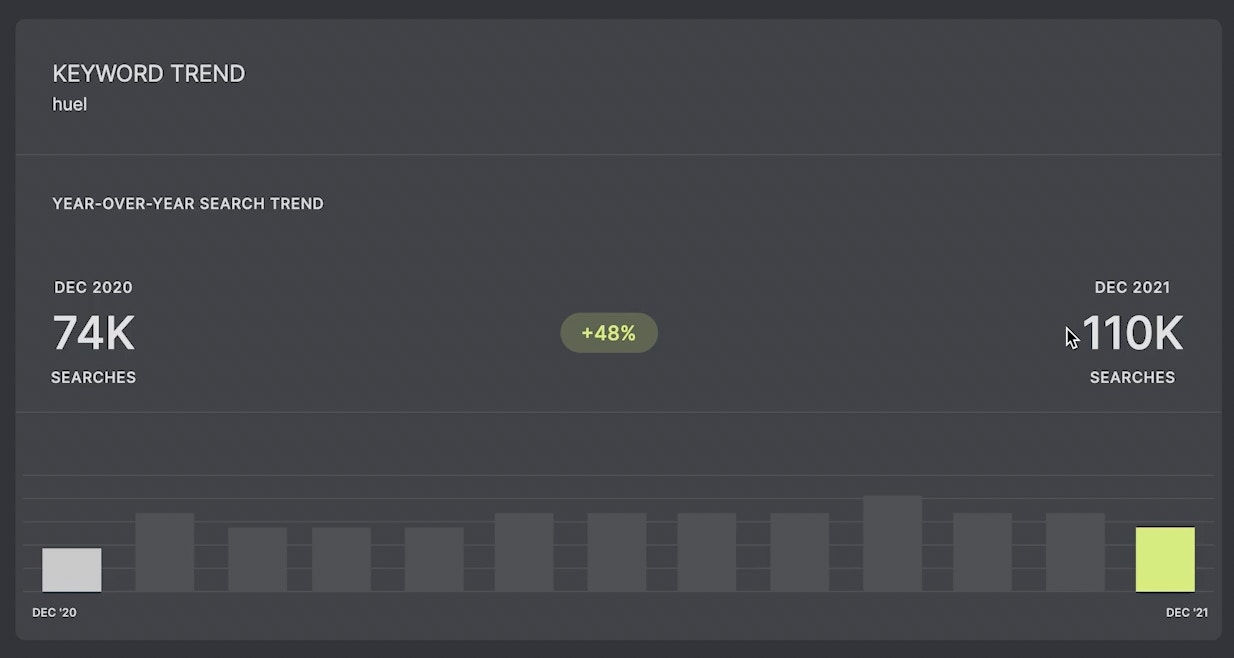
And this is where we can quickly discover search volume insights as well. So as an example, let’s use the brand Huel and we can see just how far this brand has come over the past 13 month period growing by 40% so from 74,000 searches per month 210,000 searches per month.
So as a next step, we could then compare that to competitor branded search volume, and that’s a valuable piece of market insight that extends far beyond SEO. Even those a C-suite level will find this information useful.
For further resources on SEO, check out our whitepapers and blogs, or see more handy tools below!


