
Anyone who uses Google Tag Manager will agree that preview mode has always been a great tool when adding and debugging tags. That said, it definitely wasn’t perfect… Want to see the previous GTM state after a page load? Nope. Want to debug a mobile site? Good luck. These were the two main headaches that plagued the old GTM Preview mode, but not anymore!
So what are the key differences?
One of the key differences with the new preview mode is its move into the Tag Assistant ecosystem, hence the new name ‘Tag Assistant Preview Mode’. Whilst you don’t need the Tag Assistant Chrome extension installed, it does give you some additional features that we will cover later.
Probably the most notable difference is the debug window is no longer embedded in the window you are debugging. This means all your debug data will persist whilst you navigate through various pages. Gone are the days of using third party tools or quickly trying to see your events fire before the page refreshes.
This also allows you to debug mobile previews much easier. Previously, when the debug pane was embedded on the page, enabling mobile preview mode would simply make debugging impossible. You now have the luxury of having your debug pane wherever you want!
Preview mode now uses first-party cookies instead of third. With more and more browsers now beginning to block third party cookies, this move will make using preview mode with browsers such as Safari and Firefox much easier.
Basics of using the new preview mode
Enabling preview mode is now slightly different. After pressing ‘Preview’ inside of Tag Manager, you are now taken to a separate tab, with a prompt to enter the URL you want to debug.
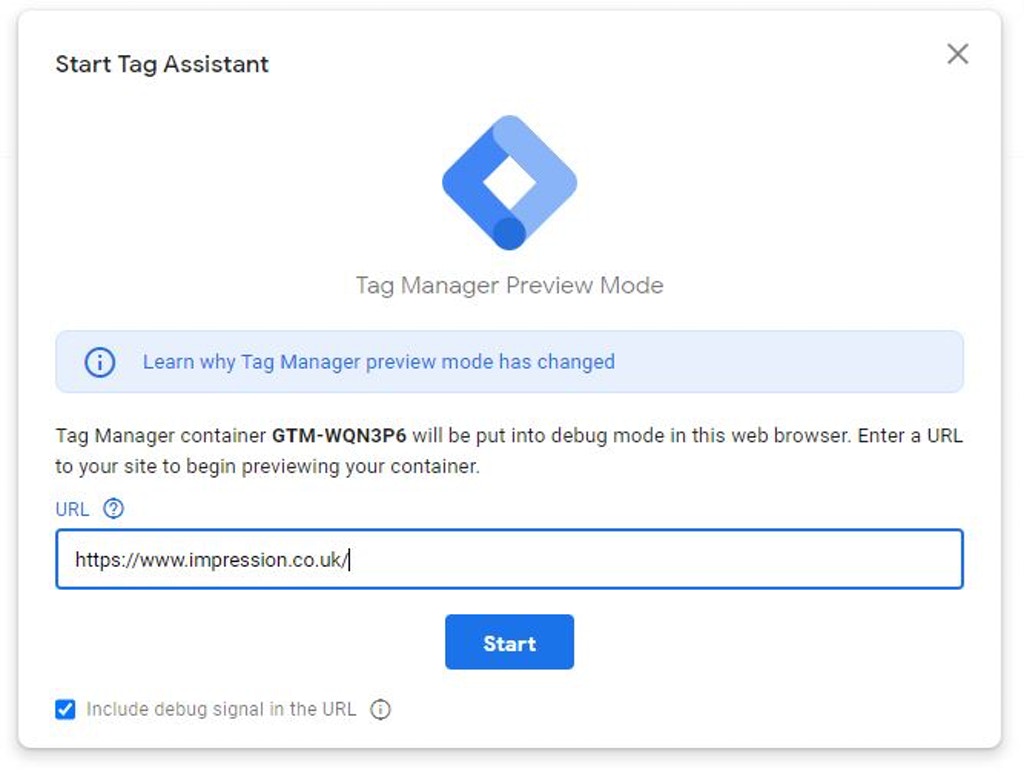
After clicking start, the entered URL will open in a new window and preview mode will attempt to connect the debug window with the page you are debugging.
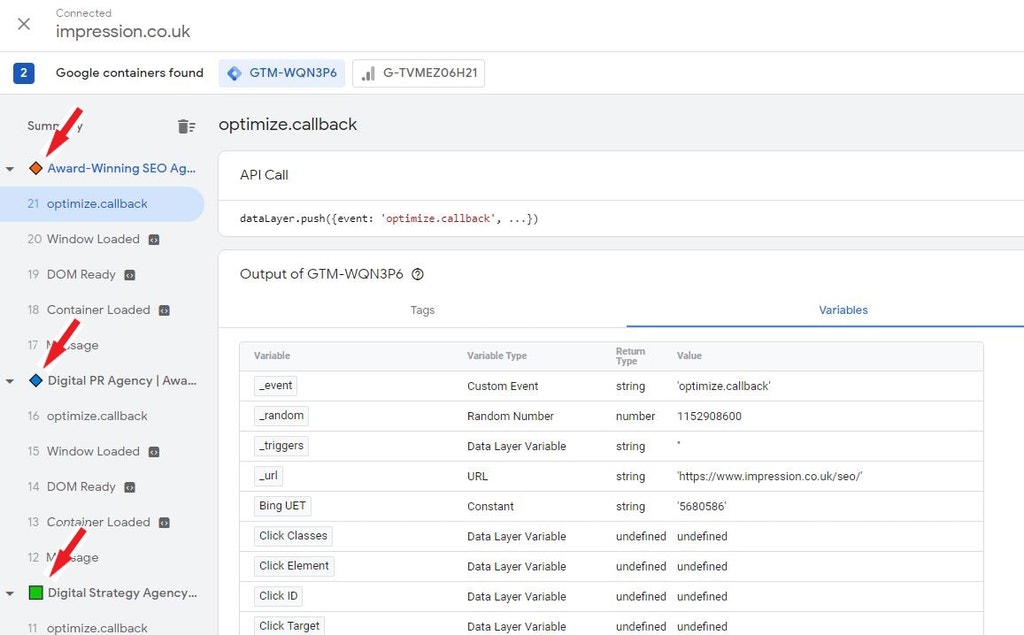
The two windows are now connected and all activity and navigation you do in that window will be logged in your debug window. The layout here will be very familiar, with your summary column on the left, and the ability to view Tags, Variables, DataLayer and any errors in the main right-hand area of the debug window.
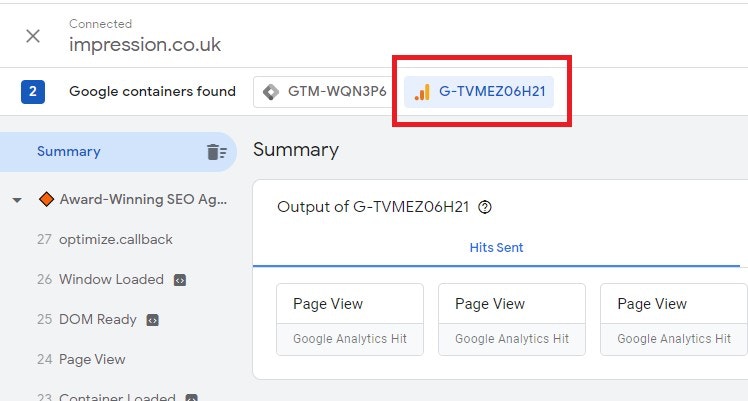
If you’re an early adopter of Google Analytics 4, aka, App + Web properties, you can also debug all hits in the same window, simply select the different configurations listed at the top of the page.
Once you are finished debugging, simply click the ‘X’ in the top left of the debug window, you will then be asked to confirm you want to stop debugging. After clicking ‘Stop debugging’ the first-party cookie will be deleted and all windows will be taken out of debug mode.
Additional features with Tag Assistant extension
If you’re a heavy Tag Manager user and reading the blog, it’s likely you’re already using Google Tag Assistant extension, if not, installing it is certainly worth it. Aside from the quick tag checks it allows you to do, it also adds some fairly useful features to the new preview mode.
The first of these features enables you to debug across multiple tabs instead of being limited to the new window that is opened. This will give you more flexibility with the console window and enable you to open the device toolbar for improved mobile debugging.
The next feature you gain actually helps you keep track of these multiple tabs. Preview mode will assign an icon to each one you open, which you can see this in the left summary, next to the page title. This icon will also appear as a favicon in the specific tab its related to, giving you an easy way to match up the debug data with the tab in question.
These new features are a huge improvement from the previous version of Google Tag Manager, and as it is still in development, it’s likely we will be seeing even more great features added in the coming months and years.


