In the modern SEO landscape, practitioners are almost powerless without their tools and the data they provide. Experience is still essential but we need the data first to leverage this experience after. Only then can we properly interpret shortfalls when it comes to more technical and data-driven optimisations.
Nowhere are SEO tools rifer than in the technical SEO camp. From cloud crawling tools such as DeepCrawl, OnCrawl and Botify to local solutions like Screaming Frog and Sitebulb, it can be an expensive space to operate in.
What’s more, the deeper you dive, the more of a requirement tools become. Logfile analysis, for example, can be achieved with a simple Google Sheet and other free solutions, but it’s far easier to interpret server logs using solutions like those mentioned above and more specialist tools like Logz.io, Loggly and Splunk (to name but a few).
The tricky part then comes after. Once you have obtained access to these tools, they largely work in silos and are disjointed from the remainder of your workflow. That means tying your efforts back to your core performance-based KPIs can be difficult and take some navigating.
In addition, the tools I noted above typically come with a high barrier to entry, meaning other stakeholders struggle to visualise your efforts in the technical SEO space. This can make some conversations difficult, especially when it comes to signing off budgets and communicating the value of your work.
That’s where Google Data Studio (GDS) can help. With a large library of custom data connectors, you can near-enough visualise any data you wish to complement another data set and tell a story. At Impression, we typically refer to these datasets as “owned goals” and “shared goals” (first coined by Laura Hampton in a digital PR context but the methodology can also be applied to a technical SEO-driven search strategy).
Here, “owned goals” refer to the metrics we can directly improve, e.g. crawling and indexing optimisations, while “shared goals” refer to those we share with in-house teams and other SEOs to help influence, i.e. improvements in visibility, traffic acquisition and revenue. With Google Data Studio, we can capture both owned and shared goals and start connecting the dots.
Many data connectors already exist that allow you to include technical-SEO driven data into your reports but after researching online, I discovered few (if any) templates exist that pull this all together. With that in mind, we created a technical SEO dashboard that’s now available for download.
Download Impression’s Technical SEO Google Data Studio Dashboard
What does the technical SEO dashboard report on?
Technical SEO metrics
Though a work in progress, the dashboard currently captures:
- Automated data from DeepCrawl, including:
- Crawling considerations
- Indexable URLs
- Non-indexable URLs via:
- Non-200 status codes: 3XXs, 4XXs, 5XXs
- Robot Directives: canonicals, meta robots noindex/nofollow tags and disallows via robots.txt
- Crawl optimisations available through your XML sitemap(s)
- Indexing considerations
- Thin URLs
- Duplicate URLs
- Orphaned URLs
- Crawling considerations
- Automated Google Analytics data, including:
- Page load times
- Server response times
- Domain lookup times
* available via various dimensions, e.g. site-wide, page, device and user-level
- Automated Chrome User Experience data, including:
- First paint
- First contentful paint
- DOM content loaded
- First input delay
*using the origin URL originally stated upon setup of the data connector.
While the idea is to build on this over time, we consider these to be integral to a technical SEO’s “owned goals” when related to a campaign’s overall progress and success. By adding this dashboard into your current GDS reports, you will be able to supplement the KPIs related to your “shared goals”.
Quarterly progress
The dashboard is only intended to report on quarterly progress. Granted, data over a longer period of time is always more valuable but with so many individual reports present, we were limited by space. Three months was the trade-off to include enough reports for it to be useful while showing enough of a date range for it to still be interpreted in a user-friendly way.
The dashboard is set to report on the previous quarter and should update automatically upon the following month of each completed quarter, i.e. April for Q1, July for Q2 etc.
Getting started
The dashboard’s current iteration only uses three sample data connectors. These are:
- The Google Sheets connector
- The Google Analytics connector
- The Chrome UX Report connector
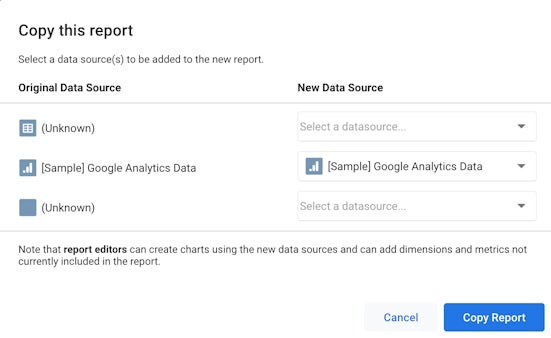
Before making a copy of the dashboard and getting stuck in, we recommend following these steps to ensure you successfully add your data to the connectors before adding them into the template:
Next steps
This dashboard is only really applicable to DeepCrawl users for now. However, over time, we can look to elaborate on it with data feeds from other technical SEO crawlers like those from Botify and OnCrawl. In addition, there are still more useful reports to see even from the likes of DeepCrawl, like those related to crawl depth and log file metrics, so we’re looking forward to building on the dashboard over time.
And that’s really our intention; for it to be a work in progress so it becomes increasingly more valuable. if you have any feedback of things you’d like to see via the technical SEO dashboard, feel free to share those with me via email or Twitter.


