If you didn’t pay much attention in maths at school, you might not have heard of statistical significance. However, if you’re going anywhere near a PPC campaign, this is something which you need to know – and you need to know it well. If you’re making decisions with data – something PPC managers do on a daily basis – it’s important that you understand what your data is actually telling you, as opposed to what you think it is telling you.
Why statistical significance is important
Put simply, statistical significance is important because it stops you from making the wrong decision about your data. Sometimes when you’re testing ad copy, you tend to look at the results and think you know which ad will lead to more conversions. It’s obvious – the one with the higher conversion rate, right? Well, not exactly.
Something which is rarely considered is that some things could be down to chance. If you flip a coin and get heads four times in a row, is your coin fixed? Probably not. However, if you roll a die 14 times and get a six every time, you’d be right to suspect that something suspicious is going on. (Either that or you need to head straight to the casino.)
Stop making business decisions with limited data
Using statistical significance to make decisions is just common sense. Here’s a simple example to illustrate.
Let’s say it’s a hot summer’s day (well…we can dream) and you’ve just set up your newly established ice cream stand, Impression Ice Cream. After extensive customer research, you’ve decided to start by offering two flavours: chocolate and vanilla. Your first three customers come along and you’re officially in business. Two of your customers buy vanilla and one buys chocolate. Since twice as many people buy vanilla than buy chocolate ice cream, would it be a good idea to throw out the chocolate and just sell vanilla ice cream?
No – because there’s not enough data! (Plus, no one really likes vanilla, they just tolerate it.)
Despite this being so glaringly obvious with our ice cream example, many PPC managers unknowingly do exactly this with their ad split tests, throwing out perfectly good ads before collecting enough data to know if they really were winners after all.
So, how do you tell if an ad’s performance is pure fluke or pure genius? Like all things in PPC, you test.
How to test your ads
I’m going to try not to get to “mathy” here, but it’s important to know intuitively what statistical significance means. Let’s throw some (easy) numbers into the mix.
Let’s say I’m running two ads and want to get as much traffic (clicks) as possible. Ad 1 has had 1,000 impressions and 50 clicks. Ad 2 has had 500 impressions and has also had 50 clicks. Since Ad 1 has a 5% click-through rate and Ad 2 has a 10% click-through rate, you might make the logical assumption that Ad 2 is the better performing ad. This is where statistical significance comes in, answering the following, all-important question:
If there was absolutely no difference between Ad 1 and Ad 2, how often would we see results like this randomly?
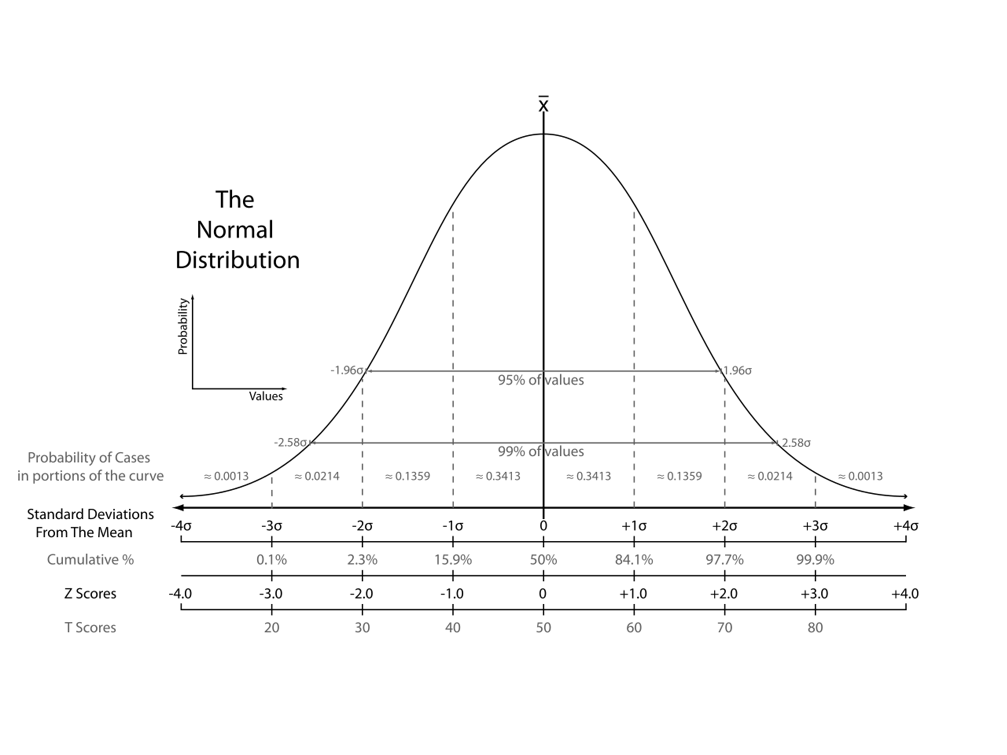
You can actually get a percentage for this exact situation, commonly called the p-value. Most of the time, you’ll want a p-value of 5% or less. A p-value of 5% means that 95% of the time, you wouldn’t expect to see results like this happening by chance and that changing to the better performing ad will almost certainly lead to an improvement in your conversion rate.
Why a 5% p-value?
Despite what the masses may tell you, there’s absolutely no reason why you’d choose 5% as opposed to 10%, 2.5% or even 1% for your p-value. It’s just that a famous statistician in the 1930s chose 5% and it stuck. If you’re happy with a 10% chance that your results are totally random, then go ahead and use 10% as your threshold. It’s all dependent on your risk tolerance, but in general, the more certain you’d like to be, the more data you need to collect.
Without getting too much into the mathematics behind it, the best way to test is by using an A/B test calculator. Plenty exist all over the internet, but if you’re an absolute beginner or are looking for something more rough and ready, I recommend Neil Patel’s A/B calculator.
Since I’m a huge data nerd, I love using the super-powerful A/B-Test Calculator on ABTestGuide.com. If you’re brave enough to try this advanced A/B test calculator, choose a one-sided hypothesis test and a 95% confidence and you’re good to go. (A 95% confidence means you’re testing to find out if you can be at least 95% certain that changing to the better converting ad variation will improve your conversion rate.)
What’s a one-sided hypothesis test? It’s super mathy, that’s what it is. Trust me on this one.
In reality, it doesn’t make much difference which calculator you choose. The most important thing is that you test!
An example
Remember our ice cream stand? We had three customers – two bought vanilla and one bought ice cream. Using Neil Patel’s calculator, we enter the number of visitors as 3 and the number of conversions as 2 (for vanilla) and 1 (for chocolate) respectively.

So although we might have a better conversion rate, it’s not statistically significant since we can only be 81% certain that changing to just offering vanilla would increase the conversion rate.
What about the ad example from before then? Ad 1 had 1,000 impressions and 50 clicks and Ad 2 had 500 impressions and 50 clicks.
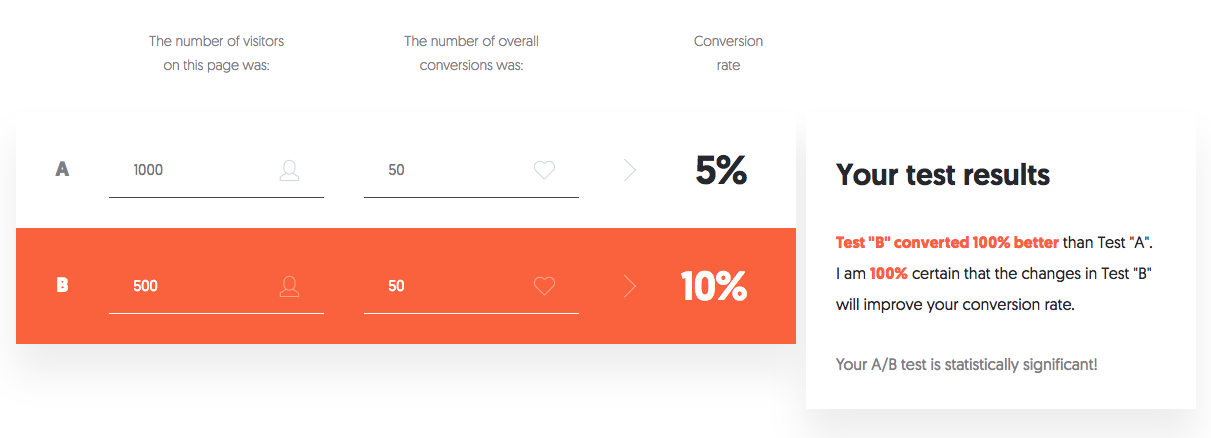
While I think that 100% confidence is almost certainly from rounding, it’s clear that Ad 2 (in this case, Test “B”) is a statistically significant winner. If you want to improve your conversion rate, you should probably switch to Ad 2 immediately.
Take a data-driven approach
At Impression, we take a data-driven approach to our PPC management. Why rely on a hunch when you can just test instead? To find out more about our data-driven strategies, visit our PPC page.


