Read the full guide below or click here to download it as a PDF.
- Introduction
- Methodology
- The top three fashion ecommerce sites
- SEO ranking factors
- Content factors
- Active blog
- Customer reviews
- Company name and address page
- Combined company page and customer review test
- Shipping/returns/payment information
- Technical factors
- Off-page factors
- Conclusion: SEO checklist for fashion ecommerce
- Suggestions for future research
- Appendix: statistical tests
- Active blog
- Statistically insignificant factors
- Combined company page and customer review test
Introduction
The fashion industry is notoriously competitive. Even prior to the COVID-19 outbreak, the prevailing mood amongst fashion leaders was not optimistic: published in November 2019, McKinsey’s State of Fashion 2020 report anticipated mounting pressure on major players to innovate in response to slowing global economic growth and new direct-to-consumer challenger brands, whilst many fashion executives foresaw an industry-wide slowdown even then.
The events of the past few months have blown many plans out of the water for the big-name brands in fashion. The economic impact of the pandemic will be felt keenly by fashion firms given the discretionary nature of the industry – and the initial evidence suggests that these businesses have suffered the worst so far, with their average market capitalization dropping almost 40% between the start of January and March 24, 2020.
All of this will amount to yet more pressure for fashion companies and their executive-level teams as consumers have less disposable income and demand levels plummet, making it increasingly difficult to compete. As firms are forced to operate in the online space now more than ever, even the most traditional of clothing brands will need to level up their digital marketing strategies.
With the burgeoning popularity of services like Google Shopping, many fashion brands are focussing their efforts on paid media, and the vast majority of them have launched at least some form of social media marketing. Furthermore, fashion executives are starting to realise the value of digital PR for building brand awareness and domain authority.
Despite the abundance of weapons in the digital marketer’s arsenal, it remains important for fashion brands to have a solid foundation in SEO. Research published by BrightEdge shows that organic search remains the dominant source of traffic on average: the 2019 report found that 53% of all trackable website traffic stems from organic, compared to 15% from paid search advertising.
Digging deeper into the comparison between organic and paid search, there are also significant differences in terms of click-through rates. Writing for Sparktoro, Rand Fishkin points out that more users click on organic listings than their paid counterparts across both desktop and mobile: in 2018, 63.6% of UK and EU Google searches resulted in the user clicking on an organic listing, compared to just 6.4% for paid.
SEO is clearly a vital component of any brand’s digital marketing strategy (not just in fashion). However, the most important SEO considerations vary between different industries and verticals. So what factors affect the organic performance of sites in this particular industry? Can we produce a holistic SEO checklist for fashion ecommerce sites? The purpose of this research is, at least in part, to answer these questions.
To this end, we have taken 100 leading fashion ecommerce sites and used 26 different tests that either measure organic performance or could be considered factors that relate to it. The resulting 2,600 data points have been used to compare and contrast these sites in terms of their SEO implementation and achievements in organic search.
We then used a ranking system to determine which one of the fashion ecommerce sites could be seen as the model in the group. The testing process facilitated a data-driven analysis of which specific factors may be contributing to their SEO performance, with all of the relevant statistical analyses included in the appendix.
Methodology
Selection of sites and factors
We selected 100 fashion ecommerce sites based on characteristics such as their domain ratings (DRs), number of top 10 organic rankings, average monthly traffic, and estimated traffic value. Only the most authoritative sites (DR >70) were considered for the study.
In order to test which factors affect organic visibility the most, we needed sites that have large numbers of top 10 organic rankings. The sites were partly chosen based on DR because more authoritative sites can generally achieve organic visibility more easily than their low-DR counterparts, making them appropriate subjects for a study into SEO ranking factors.
The following objective factors were chosen from a larger pool of ideas put forward by ecommerce specialists at Impression as a holistic representation of organic performance:
Content
- Has the blog/press section been updated in the last month?
- Is there a page with the company name and office/HQ address?
- Is the shipping/returns/payment information accessible from product pages?
- Are customer reviews clearly displayed?
Technical
- Does the site have an Extended Validation SSL Certificate?
- Is the site fully mobile friendly?*
- Performance Score (Chrome DevTools)**
- Accessibility Score (Chrome DevTools)**
- Are there any duplicate content issues?
- Is there internal linking between product pages?
- Is paginated/infinite scroll content in Google’s index?
- Are there redirect chains in place?
- Has Product structured data been properly implemented on product pages?
- Are the checkout pages no-indexed or disallowed via robots.txt?
- Have hierarchical breadcrumbs been implemented?
- Has descriptive image alt text been implemented?
Off-page
- Domain rating (DR)
- Number of live backlinks from authoritative sites (>30DR)
- Percentage of live backlinks from low authority sites (<10 DR)
- Number of broken backlinks from authoritative sites (>30DR) as percentage of total live backlinks
This paper tests the relationships between the factors above and the following organic performance metrics:
- Organic traffic (visits/month)
- Number of organic keywords
- Number of organic keywords / Number of indexed pages***
- Number of top 10 organic keywords
- Number of top 10 organic keywords / Number of indexed pages***
- Traffic value ($)
* Sites were considered to be fully mobile-friendly if they use legible font sizes, adjust the size of content to the viewport, and use appropriately sized tap targets. This was tested using the tool from TechnicalSEO.com.
** For the Chrome DevTools report, the following settings were applied: mobile, simulated fast 3G, 4x CPU slowdown. The tests were carried out using Incognito mode in order to prevent Chrome extensions from affecting the results.
*** Certain metrics were converted to a ratio by dividing the figures by the number of indexed pages. As some of the sites under investigation have millions of pages, they are capable of ranking for a far greater number of keywords than their smaller competitor sites simply by virtue of their size.
The organic keyword/indexed pages ratios were calculated to prevent the larger fashion ecommerce sites from having an unfair advantage in the scoring system, albeit that a larger site size (and larger inventory) would benefit these brands in reality.
Below, we have plotted the number of indexed pages against the number of top 10 organic keywords for each site to demonstrate the correlation between them. Aside from the anomalies on either side of the trend line, you can see a clear correlation between the two metrics:

Data collection
The off-page, traffic, and keyword data points were collected using Ahrefs. Many of the on-page and technical factors were tested through manual scraping of the sites. Google’s Structured Data Testing Tool was used to test the implementation of Product structured data.
Special thanks to the team at DeepCrawl!
The team at DeepCrawl has helpfully provided the remaining technical SEO data, setting up an account with crawls for the 100 sites under investigation and significantly reducing the amount of time taken for the data collection phase. Impression would like to thank them for all of their assistance with this research project.
The site ranking process
The final step was to determine the best fashion ecommerce site from the group, so a ranking process was devised. As the relative importance of the 25 SEO factors is unknown, no specific weighting could be assigned to each factor and it was decided that all of the factors should be considered equally important.
For numerical variables such as DR, the sites were assigned a score based on their position in the rankings (e.g. 1 point for the best site through to 100 points for 100th position); binary or dichotomous (yes/no) variables were accounted for by assigning arbitrary scores of 25 for the positive option and 50 for the negative option in each case.
The total scores were then calculated to determine which would be considered the best fashion ecommerce site in the group, with the lowest score winning.
The top three fashion ecommerce sites
According to the ranking system outlined above, the top three fashion ecommerce sites were:
- Zappos.com (642)
- Gap.com (764)
2. Nike.com (764)
Gap and Nike both scored 764, putting them in joint second place. Zappos came out on top, performing particularly well across most of the tests, with the best Accessibility Score in Chrome DevTools and top 10 positions in the following categories:
- Domain Rating (DR)
- Live backlinks from authoritative sites (>30DR)
- Percentage of live backlinks from low authority sites (<10DR)
- Organic traffic (visits per month)
- Organic keywords
- Organic keywords in positions 1-10
- Traffic value ($)
First and foremost, Zappos’ success highlights the importance of building high-quality links and maintaining a healthy backlink profile. This brand’s off-page SEO work has clearly contributed towards its impressive organic visibility, with links to the site from authoritative sources acting as E-A-T signals and increasing its PageRank.
At the same time, Zappos is an industry leader in terms of technical factors such as the accessibility of its site. Other fashion ecommerce sites should follow its example by implementing descriptive image alt text across product pages at the very least – you can find further web accessibility guidance from Google here. The Zappos site also adheres to a range of other technical SEO best practices: in addition to loading relatively quickly, it is fully mobile-friendly, utilises hierarchical breadcrumbs, and uses internal linking between product pages.
Zappos came out near the top of the pile for content factors. Most importantly, its Beyond the Box blog is regularly updated with fresh, high-quality content that targets users at every stage of the conversion funnel and drives relevant organic traffic towards the site. Within this group of 100 fashion ecommerce sites, there is a strong positive correlation between having an active blog and increased organic traffic (see the active blog analysis below).
Also related to content performance, the Zappos site features strong on-page E-A-T signals such as a page with the company name and office addresses; easily accessible shipping, returns, and payment information on product pages, and customer reviews presented alongside products. All of these factors contribute to the general presentation of the brand and its site as trustworthy.
SEO ranking factors
Having determined the best fashion ecommerce site in the group (according to our ranking system), the next section examines the correlations between the factors under investigation and success in organic search.
Content factors
Whilst content is an innately subjective focus within SEO, there are some content-related factors that can be tested objectively and, when tested, correlate with organic visibility or performance. Just four of the factors in this investigation were about content:
- Has the blog/press section been updated in the last month?
- Are customer reviews clearly displayed?
- Is there a page with the company name and office/HQ address?
- Is the shipping/returns/payment information accessible from product pages?
Active blog
The content factor that had the greatest positive correlation with organic traffic was an active blog or press section: sites with active blogs saw 277% more traffic on average than those without a recently updated blog (5,984,889 vs 2,160,510). This finding is statistically significant: there is only a 0.11% chance that it wouldn’t apply to other fashion ecommerce sites outside of this study (see the statistical test for active blogs below).
From this result, we can infer that a recently updated blog is a highly valuable asset for fashion ecommerce sites, provided that the additional traffic consists of relevant users who are interested in making a purchase after reading a blog. Interestingly, we found that a number of fashion brands have recently discontinued their blogs, a move which seems ill-advised in the context of this finding.
Customer reviews
On-page customer reviews provide users with vital product information that can help to inform their purchase decisions. Academic research has found that consumers rely on and trust user-generated content like reviews to a far greater extent than marketer-generated content, so we know that reviews play an incredibly important role in the consumer decision-making process. But does Google reward sites that include on-page customer reviews?
There was also a reasonably strong positive correlation between sites that display customer reviews on product pages and organic visibility: in this study, the brands that provide users with reviews on their product pages had an average of 0.95 top 10 keywords per indexed page compared to 0.54 for those that don’t. Although this finding applies within the context of the 100 sites under investigation here, it falls just outside of the boundary for statistical significance (see the statistical test for customer reviews below).
It’s important to note that any correlation between on-page customer reviews and organic visibility may be due to the presence of user-generated content on product pages. If the reviews were sourced directly from site visitors (rather than pulled through from a third-party site), then the user-generated content could be adding key information to the pages and enhancing their topical relevance – this, in turn, could help them to rank for a wider cross-section of keywords.
Company name and address page
Similar to customer reviews, dedicated company name and address pages could be seen as an E-A-T factor for fashion ecommerce sites, serving as a signal of trustworthiness in particular. Pages that clearly state the name of the company and its office address(es) help consumers to find out where a company is based, alleviating any worries they may have about the legitimacy of the online business.
The fashion ecommerce sites that do have a company page with office address(es) had 0.73 top 10 keywords per indexed page on average whilst those without had 0.68, so there is a slight positive correlation in the context of this study. However, this finding is not statistically significant (see the statistical test for company pages below).
Combined company page and customer review test
Given that company address pages and customer reviews relate to E-A-T, we decided to compare the organic visibility of sites that have both of these features with those that have neither. For this group of 100 sites, there was a clear positive correlation: those with both a company page and customer reviews had 1.13 top 10 keywords per indexed page, whilst those with neither had just 0.76. However this finding is not statistically significant, so it does not necessarily apply to other fashion ecommerce sites (see the statistical test for company page-customer reviews below).
Shipping/returns/payment information
It’s currently best practice for fashion ecommerce sites to provide shipping, returns, and payment information on all product pages so that customers are fully aware of this important information. This is another example of a content factor that pertains to E-A-T, specifically trustworthiness. However, as 90% of the sites in this study have shipping/returns/payment information on product pages, the data would not allow for the correlation to be tested (see the full explanation for this below).
Technical factors
There are a huge range of technical SEO factors that can be measured on third-party sites, enabling correlations with organic visibility metrics to be measured with ease. The following 11 factors were investigated:
- Does the site have an Extended Validation SSL Certificate?
- Is the site fully mobile friendly?
- Performance Score (Chrome DevTools)
- Accessibility Score (Chrome DevTools)
- Are there any duplicate content issues?
- Is there internal linking between product pages?
- Is paginated/infinite scroll content in Google’s index?
- Are there redirect chains in place?
- Has Product structured data been properly implemented on product pages?
- Are the checkout pages no-indexed or disallowed via robots.txt?
- Have hierarchical breadcrumbs been implemented?
- Has descriptive image alt text been implemented?
Extended validation SSL certificate
Google announced that HTTPS is a ranking signal in 2014, but has not provided any further documentation distinguishing between the effects of different types of certificate on organic performance. Internet security protocols are particularly important for ecommerce sites as they help to protect customers’ personal and financial data, so it’s very likely that Google views Extended Validation SSL certificates (EVSCs) as a ranking factor.
Every single website in this study uses the HTTPS protocol, but just 30 have EVSCs. Sites with EVSCs had an average of 1.07 top 10 organic keywords per indexed page, whilst those without had just 0.56 on average. What’s more, this finding is statistically significant: there’s only a 3.86% chance that it wouldn’t apply to other fashion ecommerce sites. See the complete information on the EVSCs statistical test below.
Mobile friendliness
In March 2015, an official announcement on Google’s Webmaster Central Blog revealed that mobile-friendliness would be considered a direct ranking signal as of April that year. More recently, Google has stated that mobile-first indexing will apply to all sites within the next year, meaning that the search engine will crawl and index all pages from the perspective of a phone browser. In light of these developments, we were fairly confident that there would be some form of correlation between mobile-friendliness and organic visibility.
In reality, however, there was no correlation between mobile-friendliness and organic rankings. 69 of the 100 sites were fully mobile-friendly and 39 were either partially mobile-friendly or not at all. The majority of sites adjusted the size of content to the viewport, but many did not use tap targets that were appropriately sized for mobile users. The fully mobile-friendly sites had an average of 0.71 top 10 organic keywords per indexed page compared to 0.73 for non-mobile-friendly sites.
Performance and accessibility scores from Chrome DevTools
The Performance and Accessibility Scores from Chrome DevTools were also investigated to determine if they correlate with organic visibility. The Performance Score is a measure of site speed that takes into account metrics such as first contentful paint (FCP) and time to interactive; the Accessibility Score tests how easily a website can be navigated using a keyboard or screen reader by determining whether a page is properly marked up to facilitate this.
As we know from Google’s Web blog, site speed and accessibility are both direct ranking factors – and speed will become even more important when Core Web Vitals are introduced to Google’s algorithms. Most SEOs already understand the importance of site speed, but a recent Searchmetrics study found that we are neglecting web accessibility when it comes to technical optimisation. With this in mind, we wanted to test whether there was a relationship between sites’ Performance scores, Accessibility scores, and organic visibility, so we plotted them against the number of top 10 organic keywords per indexed page:
From these two graphs, we can see that the two scores seem to correlate roughly with the top 10 organic keywords per indexed page metric. They both feature anomalies that don’t fit particularly close to the trend lines, so the correlations are not as strong as we might have expected. Interestingly, the correlation appears to be stronger with the Accessibility Score than the Performance Score, suggesting that the former metric is of greater importance to organic visibility.


To examine the strength of the correlations objectively, we carried out statistical tests. Confirming what we had already inferred from the graphs above, the correlation between organic visibility and Accessibility was found to be the strongest. Whilst correlations exist with this group of sites, it’s important to note that these findings are statistically insignificant, so they wouldn’t necessarily apply elsewhere (see the statistical analysis for Performance and Accessibility scores below).
Duplicate content issues
Although there are no ranking penalties associated with duplicate content, Google will always attempt to display just one page in the search results when duplicate content is found across multiple pages, which could result in the desired version being omitted. As a result, it’s important for brands to manage their duplicate content, which is often found in large quantities on fashion ecommerce sites.
One method of managing duplicate content in a fashion ecommerce context is to canonicalise matching product pages properly such that the desired page is served to users in the organic listings. Particularly with smaller sites, it is also best practice to write your own unique descriptions for each product and category page. For more detailed information on how to identify and prevent duplicate content issues, take a look at Impression’s guide to duplicate content checks.
A further consideration here is that sites with lots of identical content will be limiting the number of pages that can rank in Google. For example, if 100 product pages on a site feature duplicate product descriptions and no canonicalisation is in place, then only one of the pages should be included in search results. As such, we wanted to test if the presence of duplicate content correlated with organic visibility.
The sites with duplicate content issues flagged by DeepCrawl had an average of 0.85 top 10 organic keywords per indexed page, whereas those without any issues had 0.35. We clearly shouldn’t interpret this as a sign that duplicate content issues increase organic visibility. It is more likely that duplicate content issues had little to no effect on organic rankings and that the difference between the two groups can be explained through a range of other factors.
Internal linking
We also investigated the use of internal linking between product pages. Not only does this enhance the user experience by facilitating easier navigation between products whilst increasing opportunities for up- and cross-sells, but it also allows link equity to be passed between pages on a site and thereby promotes greater organic visibility (in theory). With this in mind, we analysed the relationship between internal linking and organic rankings.
90 sites had internal linking between product pages and 10 did not. In this case, sites with internal linking had 0.76 top 10 organic keywords per indexed page on average whilst those without had 0.40. As we know, however, comparing averages between two samples of drastically different sizes would be flawed. It would be interesting to repeat this analysis with a larger group of fashion ecommerce sites and a more equal division between the two groups, enabling us to confirm whether internal linking between product pages really correlates with organic visibility or not.
Is paginated/infinite scroll content indexed?
All of the fashion ecommerce sites investigated here require pagination or infinite scroll in order to display long lists of products. Where pagination is used, each component page should have its own unique URL, allowing for indexing of all of the content in a paginated series. This is not always the case with infinite scroll, however, with many fashion brands using just one URL for a vast number of products, relying on JavaScript and user interaction to load deeper content. In this situation, there is a risk that only the initially loaded products will be crawled, indexed, and ranked properly. As such, we wanted to test whether there is a relationship between paginated or infinite scroll content being indexed and the site’s number of organic keywords per indexed page.
The advice on Google’s Webmaster Central Blog states that sites should “chunk [their] infinite scroll content into component pages that can be accessed when JavaScript is disabled,” thereby ensuring that all content can be accessed by web crawlers. This is something we detail in our SEO-friendly infinite scroll post. To test whether a site’s paginated or infinite scroll content is being indexed, we first determined whether products in a series had been “chunked” together and given unique URLs, then used site:URL to see if all of the pages in the series were in Google’s index.
Of the 100 sites examined here, just 28 had paginated or infinite scroll content that was indexed. There were several examples of fashion brands that had created unique URLs for the entire series of products, but these URLs were not being indexed. Equally, many sites used infinite scroll but included all of the products in a series on one URL. When testing the relationship with the number of organic keywords per indexed page, the sites with indexed content in pagination or infinite scroll had an average of 2.88 organic keywords per indexed page, compared to 3.98 for the other group.
Again, we need to be careful about what we infer from this. Enabling all of the products in a series to be indexed will certainly not harm the organic visibility of the site. In the case of these 100 sites, a wide range of other factors will be influencing the number of organic keywords that each site is ranking for. That said, it is clear that there is no relationship between indexed pagination or infinite scroll and organic visibility in this particular context. It would be interesting to test whether there is a correlation when examining a much larger sample.
Redirect chains
Redirect chains can have a negative impact on SEO. Firstly, chains of 301 redirects increase page loading times and create a poor user experience. Secondly, each step in a redirect chain causes about 10-15% of link equity to be lost, with negative effects on overall PageRank. As such, we wanted to test the effect of redirect chains on organic visibility across the 100 sites.
As with the mobile-friendly test, the result was surprising: the 55 sites that with redirect chains had an average of 0.83 top 10 organic keywords per indexed page, whilst the other 45 had just 0.57. It would clearly be wrong to infer that redirect chains are actually enhancing the organic visibility of these sites – here, other more influential factors will have caused the group with redirect chains to rank more highly and the difference between the groups is likely to be a coincidence.
Structured data
Although Google’s John Mueller has stated that structured data is not a direct ranking factor, it provides the search engine with a better understanding of your content and can therefore help to improve rankings in an indirect manner. The correct implementation of structured data on a page, for example Product schema, enables Google to use it for organic search engine results page (SERP) features and include it in the organic shopping feed. As such, we wanted to investigate the use of Product schema across these 100 sites.
Whilst most sites had attempted to mark up their product pages in this way, in many cases there were implementation errors such as incomplete data in required fields (incomplete data in “recommended” fields was deemed to be acceptable for the purposes of this investigation). In total, 63 sites had implemented Product structured data correctly, whilst the remaining 37 sites had either incorrectly implemented the schema or not attempted to do so in the first place.
Sites with the structured data had an average of 0.73 top 10 keywords per indexed page, compared to 0.70 for those without. Even within this group of 100 sites, the use of Product structured data had little to no correlation with organic rankings.
Checkout pages no-indexed or disallowed via Robots.txt
The best practice for ecommerce sites is to no-index checkout pages by adding the meta tag <meta name=”robots” content=”noindex”> to the header in their HTML or disallow them via robots.txt. SEOs generally adhere to this standard because there’s no reason for users to search for checkout pages – moreover, indexed checkout pages could cause security threats and duplicate content issues, so it’s preferable to avoid them being discoverable.
The ecommerce platform, Shopify, argues that no-indexing pages also helps to “block page content that might otherwise reduce the effectiveness of your SEO strategy by stealing PageRank”. As such, we decided to test whether sites that hadn’t no-indexed these pages had worse organic visibility than those which had.
41 of the 100 sites had no-indexed or disallowed their checkout pages whilst 59 had not – the former group had 0.79 top 10 organic keywords per indexed page on average whilst the latter group had just 0.67. However, this test was not statistically significant (see the no-index analysis below).
Hierarchical breadcrumbs
Hierarchical breadcrumbs help users to navigate through a website, enabling them to jump backwards and forwards to adjacent levels of the site’s architecture. By making the structure of a site highly visible, breadcrumbs also ensure that a logical architecture is chosen from the outset and link equity is passed through to the appropriate pages. Connected to this, breadcrumbs also facilitate easier crawling by web crawlers.
In light of all of these factors, we wanted to test whether there was any correlation between the presence of hierarchical breadcrumbs and organic visibility. 69 of the sites in this study had used hierarchical breadcrumbs whereas 31 had not. Those with hierarchical breadcrumbs had 0.80 top 10 organic keywords per indexed page on average whilst those without had 0.53. That said, this finding is statistically insignificant and we can’t say for definite that it would apply for other sites (see the statistical analysis on breadcrumbs below).
Descriptive image alt text
The use of descriptive image alt text on product page images was tested as part of this study for a number of reasons. Firstly, this feature helps Google to understand the subject matter of an image; in addition, image alt text enables screen readers to describe the content of images for the visually impaired, making sites more accessible to all users. Since Google explicitly advises all webmasters to implement descriptive image alt text, we wanted to test whether there is a correlation here with organic visibility.
The vast majority of sites have implemented image alt text in some form, although there were a few examples of insufficient, one-word descriptions that were not deemed to be descriptive enough. In total, 74 sites had descriptive image alt text whilst 26 did not. The average number of top 10 organic keywords per indexed page was 0.81 for those with descriptive image alt text and 0.46 for those without. However, this finding is not statistically significant (see the analysis on image alt text below).
Off-page factors
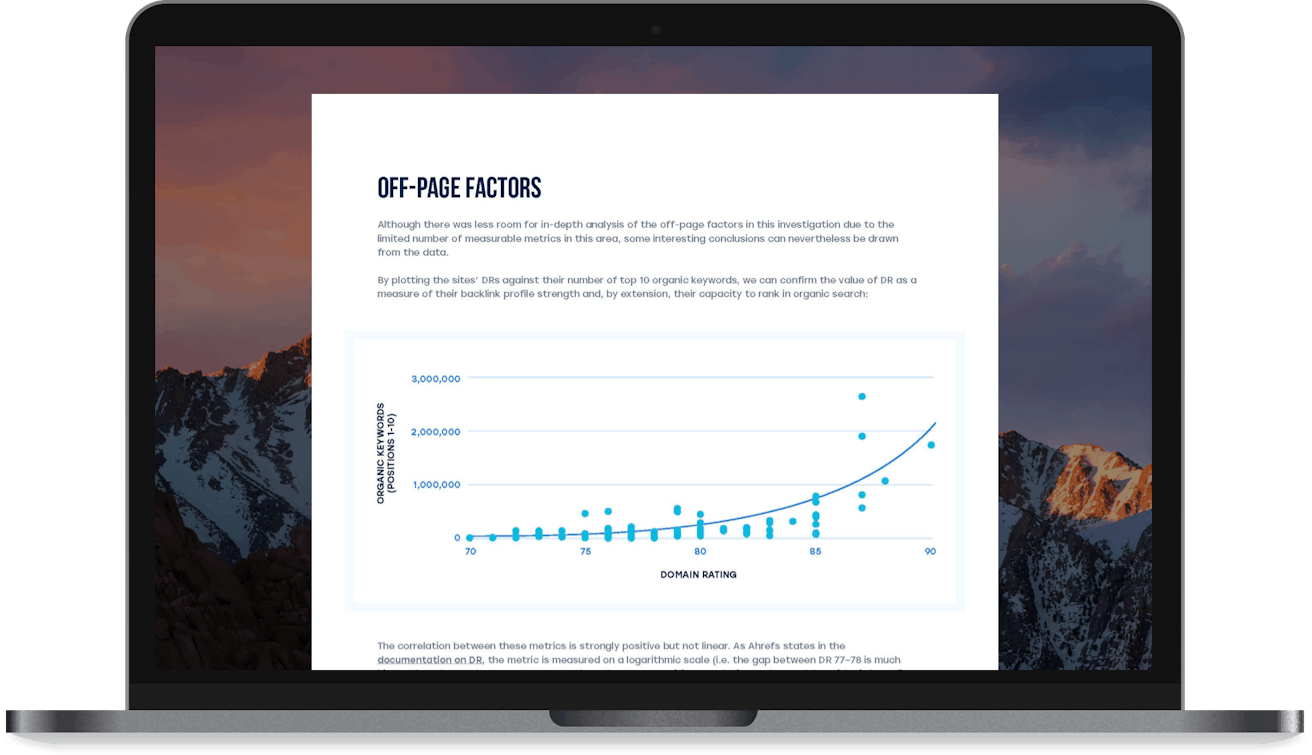
Although there was less room for in-depth analysis of the off-page factors in this investigation due to the limited number of measurable metrics in this area, some interesting conclusions can nevertheless be drawn from the data.
By plotting the sites’ DRs against their number of top 10 organic keywords, we can confirm the value of DR as a measure of their backlink profile strength and, by extension, their capacity to rank in organic search:
The correlation between these metrics is strongly positive but not linear. As Ahrefs states in the documentation on DR, the metric is measured on a logarithmic scale (i.e. the gap between DR 77–78 is much bigger than the one between DR 27–28). Thus, the strong positive correlation and curved, logarithmic best fit line both confirm the impact that DR is widely believed to have; moreover, the graph shows that DR is a fairly accurate predictor of organic ranking capacity within this sample.

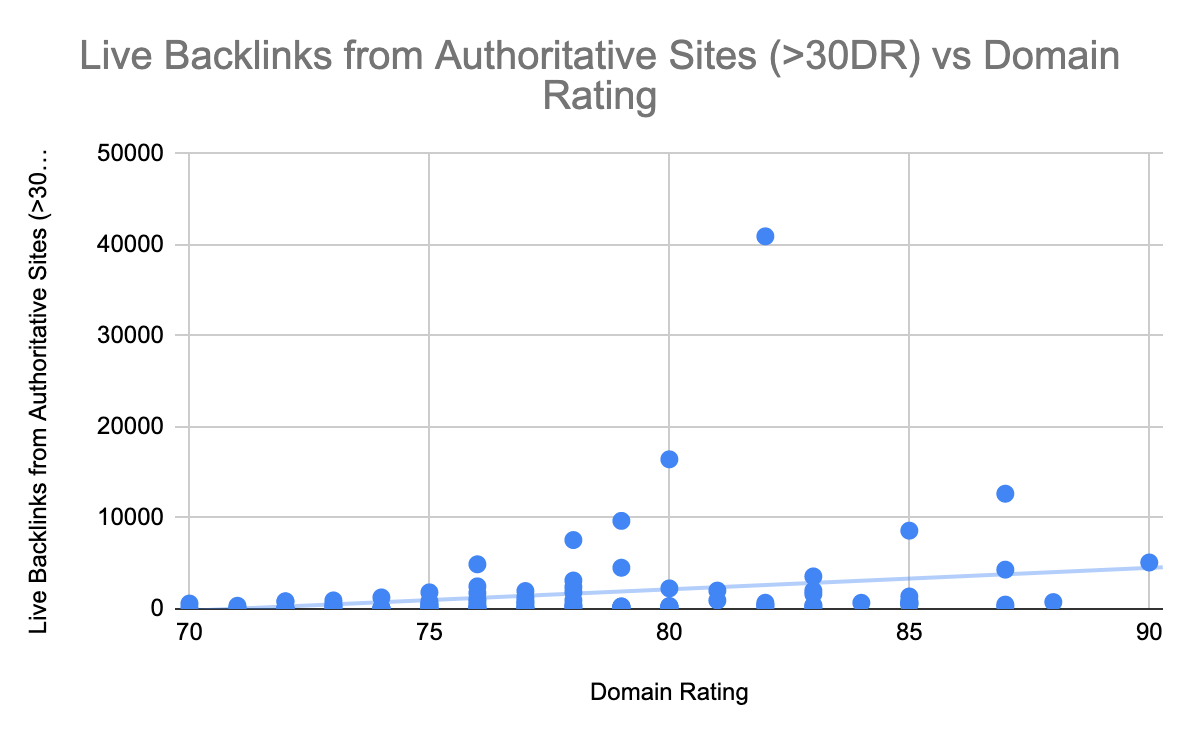
Authoritative backlinks
To confirm the relationship between backlink profile and DR, the number of authoritative links (>DR 30) was plotted against DR for the 100 sites:
Visually, we can see that there is some positive correlation here, but it isn’t as strong as the plot of DR and top 10 organic keywords. From this, we can infer that the number of authoritative backlinks plays a part in determining DR, but there are other considerations to take into account. For example, low-quality or spammy links will have an effect on DR, as well as factors such as the rate of link acquisition.
Low-quality links
In an effort to test out the influence of low-quality links in this group of sites, we plotted a graph to show the percentage of low authority links (<10DR) in sites’ backlink profiles against DR:
There’s a slight negative correlation here, suggesting that <10DR links could have a small impact on DR, but the influence certainly isn’t pronounced. As we know, provided that low DR links aren’t from illegitimate sources, they may not affect DR or organic visibility whatsoever.
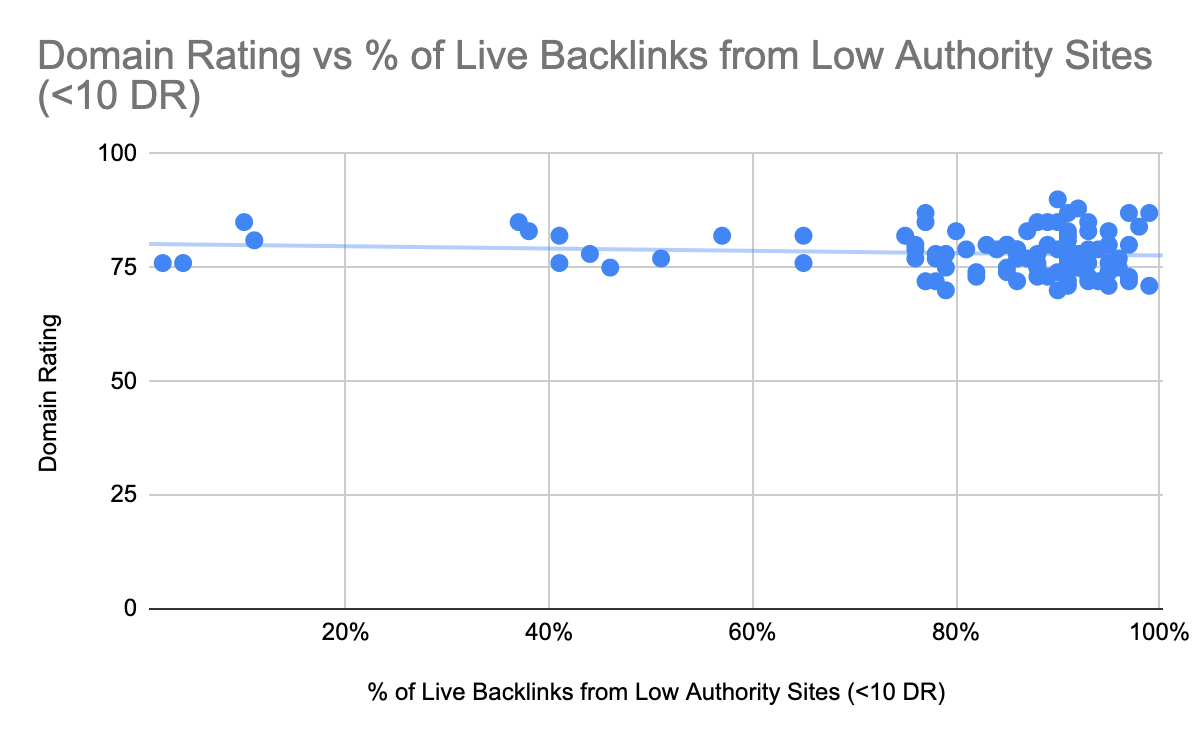
As a result, fashion ecommerce sites should avoid blanket disavowing links with low DRs, domain authorities (Moz), or high-risk scores (Kerboo, LinkResearchTools). Backlink analysis tools can be really helpful, but it is always worth manually assessing the quality of links before submitting a disavow file to make sure that link equity is not lost unnecessarily.
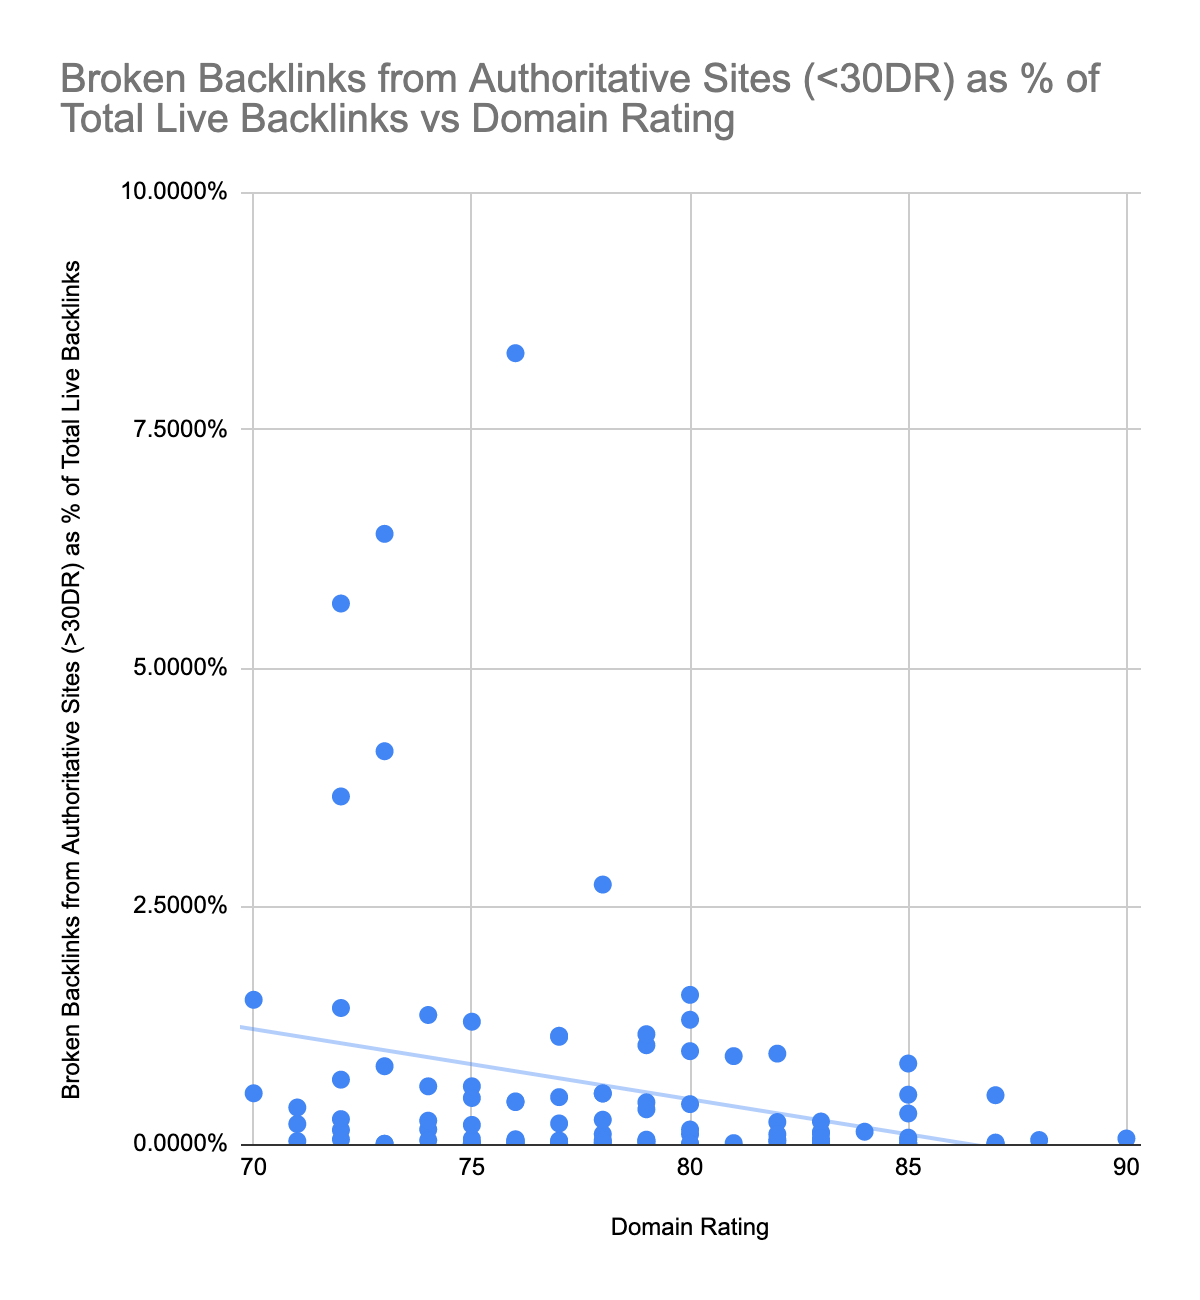
Broken backlinks
The final off-page test we carried out was to test if a relationship exists between a site’s DR and the number of broken backlinks it has from authoritative sources (>30DR), which we investigated as a percentage of total live inbound links to account for the disparity in backlink profiles. The rationale behind this test is that 301 redirects should be implemented when a link from an authoritative site breaks (e.g. if the recipient page is removed from the site). A high number of broken backlinks from authoritative sources suggests that link equity is going to waste, potentially limiting the recipient site’s DR.
When we looked into the sources of broken links towards these fashion ecommerce sites, there were many examples of valuable backlinks going to waste. Some of the sites with relatively low DRs have broken backlinks from highly relevant, authoritative sources such as the fashion sections of The Guardian and The Daily Telegraph. Simply redirecting the 404 recipient pages to another similar page would enable these brands to reclaim the lost link equity.
As you can see from the graph below, there is a relationship between broken backlinks and DR in the context of these 100 fashion ecommerce sites:
The trend line indicates a slight negative correlation between the DRs of the sites and how many broken backlinks they have from >30DR sources as a percentage of their total live backlinks. It’s worth noting that none of the sites with more than 1.5% broken backlinks from authoritative sources have a DR of above 80, albeit that the site with the most broken links does not have the lowest DR. Within this group of fashion ecommerce sites, at least, those that put in more effort redirecting broken backlinks and retaining link equity tend to have higher DRs.
Unfortunately, due to the fact that DR is measured on a logarithmic rather than linear scale, statistical testing of the relationships between DR and the other metrics considered here is not possible. To convert a log scale to linear and calculate the strength of the correlation, you would need the log base (a value that is constantly changing in the context of DR as Ahrefs’ data updates). From the graphs, we can see that correlation exists within this group of sites, but we can’t test the strength of them.
Conclusion: SEO checklist for fashion ecommerce
Before we proceed to the SEO checklist for fashion ecommerce, it’s important to note that these findings only apply when taking into account the 100 sites involved in this study. You won’t necessarily observe the same sorts of correlations with organic visibility or performance for all fashion ecommerce sites. There is a small chance (<5%) that even statistically significant findings won’t apply in the wider population (see the appendix for more on this).
That said, ensuring that your website adheres to the following standards will not hurt its performance and will likely provide at least some SEO or user experience benefit. In certain cases, we didn’t find any correlations with organic visibility but the features could still improve your site in other ways.
For example, redirect chains had little impact in this study, but eliminating them would certainly enhance a site’s UX. Similarly, Product structured data had no effect on rankings in this study, but we know that it can improve the appearance of your organic listings in the SERPs and enable your products to be used in Google’s organic shopping feed, so it’s worth implementing.
Based on this paper’s analysis of content, technical, and off-page SEO considerations, certain factors stood out as being particularly important for organic visibility within this group of fashion ecommerce sites. You can use the following checklists to audit your brand’s site:
Content checklist
- Does your brand maintain an active on-site blog?
- Are customer reviews displayed on your product pages?
- Does your site have a company page with office address(es) rather than just store locations?
Technical checklist
- Have you got an Extended Validation SSL certificate?
- Are page speeds satisfactory across the site? Could they be improved?
- Have you used descriptive image alt text to make pages accessible to all users?
- Does your site use hierarchical breadcrumbs throughout?
- Are checkout pages no-indexed or disallowed via robots.txt?
Off-Page checklist
- Have you spent time acquiring high-quality backlinks to increase your site’s domain rating (DR)? If your internal resource doesn’t allow for this, have you contacted a relevant agency?
- Following a manual inspection, have you considered disassociating yourself from harmful, low-quality linking sites via techniques such as a disavow?
- Have you fixed all broken backlinks from relevant, authoritative sites?
Suggestions for future research
This research has achieved its aim in establishing which of these factors are important for the organic visibility of these fashion ecommerce sites. However, we can only say for certain that the findings apply in the context of these 100 brands (see the statistical tests in the appendix below to learn more about the exact probability that each finding would apply for the wider population of fashion ecommerce sites). Follow-up studies should include data from a larger number of sites to increase the chance that the findings would apply elsewhere.
Future researchers could also come closer to establishing the exact relative importance of ranking factors by using multivariate regression analysis. This technique takes a number of numerical independent variables (e.g. Performance and Accessibility scores) and one numerical dependent variable (e.g. number of top 10 organic keywords), then analyses the extent to which each of the independent variables contributes to the dependent variable.
Using regression analysis, you could calculate precise scores that show the importance of each individual ranking factor. This type of statistical analysis also allows you to work out how well your independent variables account for the observed variation in the dependent variable, so you could work out the extent to which organic visibility is being affected by factors that you haven’t thought to consider in your model. For example, you would be able to state that the 26 variables under investigation can explain exactly 65% of the variation in organic visibility, suggesting that you need to consider other variables to account for the remaining 35%.
If you’re interested in getting involved with this kind of study in the future, don’t hesitate to get in touch.
Appendix: statistical tests
For each of the potential ranking factors, a statistical test was carried out to determine if the findings could be applied to the wider population of fashion ecommerce sites outside of this investigation. Multiple statistical tests have been used here, as different types of data necessitate different tests.
In many cases, the findings are relevant to this group of sites but are unlikely to apply in the same way elsewhere – although correlations exist between certain factors and organic performance within this set of data, we might not find them if we repeated this study with a different set of sites.
Statistically significant factors
Despite the statistical insignificance of many of the tests, the following two factors correlated with organic performance in this investigation but were also found to be statistically significant:
- Active blog
- Extended SSL certificate
Active blog
Sites with active blogs saw 277% more traffic on average than those without a recently updated blog (5,984,889 vs 2,160,510). As the sample size was large enough, a two-sample z-test was used to assess the statistical significance of this finding and judge whether it could be applied to other fashion ecommerce sites outside of the study.
Two-Sample Z-Test
P-value = 0.00108 (<0.05)
Z-value = 3.2672 (<1.96)
With a p-value of 0.00108 (<0.05) and a z-value of 3.2672 (<1.96), we can reject the null hypothesis that sites with active blogs have equal mean traffic to those without updated blogs and conclude that the finding is statistically significant.
The probability that the blog-related finding would not apply to the wider population is just 0.11%. As such, there is a 99.89% likelihood that having a recently updated blog would correlate with greater traffic for other fashion ecommerce sites.
Extended SSL certificate
Within this group of fashion ecommerce sites, the technical factor that had the clearest positive correlation with organic performance was the use of Extended Validation SSL Certificates (EVSCs). EVSCs are a type of security certificate that costs more than the standard version and requires detailed offline examination of a company. Whilst Google announced that HTTPS is a ranking signal in 2014, they have not provided any further documentation distinguishing between the effects of different types of certificate on organic performance.
Every single website in this study uses the HTTPS protocol, but just 30 have EVSCs. Sites with EVSCs had an average of 1.0703 top 10 organic keywords per indexed page, whilst those without had just 0.5630 on average.
Two-Sample Z-Test
P-value = 0.0386 (<0.05)
Z-value = 2.0680 (>1.96)
The two-sample z-test produced a p-value of 0.0386 (<0.05) and a z-value of 2.0680 (>1.96), so the test was statistically significant and we can reject the null hypothesis that sites with EVSCs have the same number of top 10 organic keywords per indexed page on average as those without them in this group.
There is a 3.86% chance that this would not apply to the wider population (or a 96.14% chance that there would be a positive correlation between EVSCs and organic visibility for other fashion ecommerce sites). We can be reasonably confident in saying that an EVSC is an important asset for the SEO performance of any fashion ecommerce site.
Inferences: correlation not causation
There is statistical backing here to suggest that these factors are highly likely to correlate with organic visibility and performance for fashion ecommerce sites beyond this group of 100 brands. We still can’t infer causation, however, because there are so many other factors that affect organic rankings and traffic.
Despite this, the finding relating to blogs is noteworthy: the sites with active blogs had 277% more traffic on average than those without, and the two-sample z-test demonstrated that there was only a 0.11% chance that this finding would not apply to the wider population.
Statistically insignificant factors
Some other correlating factors such as customer reviews came very close to producing statistically significant results when tested, but narrowly missed out: no other tests produced a p-value of less than 0.05. In statistics, we generally take this to be the threshold for statistical significance; if we can conclude that there is less than a 5% chance that our result would not apply to the wider population, then the result can be classed as statistically significant.
This final section of the report will provide the details of the tests that produced statistically insignificant results. A quick disclaimer before we go any further – much like any form of statistical analysis, this section contains a lot of numbers, test results, and repetitiveness, but without it there would be no statistical backing for anything that has been said in this report.
Company name and address page
Those with a company name and address page had 0.7340 top 10 keywords/number of indexed pages on average whilst those without had 0.6790.
Two-Sample Z-Test
P-value = 0.817673 (>0.05)
Z-value = -0.230539 (>-1.96)
The two-sample z-test for the company page finding produced a p-value of 0.817673 (>0.05) and a z-value of -0.230539 (>-1.96), so we cannot reject the null hypothesis that sites with company pages have equal mean traffic to those without them and we must conclude that the test is not statistically significant.
There is an 81.8% chance that the company page finding would not apply to the wide population, so it is unlikely that having a page with the company name and office address would correlate with increased numbers of top 10 organic keywords for other fashion ecommerce sites. That said, the finding still applies within the context of these 100 sites.
Customer reviews
Brands that provide users with reviews on their product pages had 0.9540 on average compared to 0.5350 for those that don’t.
Two-Sample Z-Test
P-value = 0.0664306 (>0.05)
Z-value = 1.835507 (<1.96)
For on-page customer reviews, the p-value was 0.0664306 (>0.05) and the z-value was 1.835507 (<1.96), so we cannot reject the null hypothesis that sites with on-page reviews have the same mean number of top 10 organic keywords as those without them. As such, we must conclude that the test is not statistically significant.
From this, we can say that there is a 93.4% probability that on-page reviews would correlate with increased organic visibility for the wider population of fashion ecommerce sites and a 6.6% probability that this finding wouldn’t apply. This figure is close to statistical significance but is just greater than 5%, the acceptable chance of a type I error (a type I error occurs when we reject a null hypothesis that is actually true in the general population).
Combined company page and customer review test
Sites that have both a company page and on-page customer reviews had 1.127 top 10 keywords per indexed page, and those with neither had just 0.755.
Two-Sample Z-Test
P-value = 0.368012 (>0.05)
Z-value = -0.900204 (>1.96)
Testing the combined company page-customer review finding, the p-value was 0.368012 (>0.05) and the z-value was -0.900204 (<-1.96), so we cannot reject the null hypothesis that sites with both features have an equal number of top 10 organic keywords as those with neither and must conclude that the finding is not statistically significant.
The chance that the combined company page-customer review finding would not apply in the wider population is 36.8%, so it’s not that likely that there would be a positive correlation between having these features and increased top 10 organic keywords for other fashion ecommerce sites.
Shipping/returns/payment Information
When looking to see whether the brands had provided shipping/returns/payment information that was easily accessible from product pages, just seven of them had not. Comparing the averages of two groups so different in size would be flawed, as is shown by the fact that sites with this information had an average of just 0.6948 top 10 keywords per indexed page whilst those without had 0.9857. In any case, the vast majority of fashion ecommerce sites provide this information on product pages, so its differentiating effect on organic visibility is likely to be minimal.
Performance and accessibility scores from chrome DevTools
Given that there seemed to be slight positive correlations between these scores and organic visibility, Kendall rank correlation tests were carried out to determine if correlations actually exist and, if so, calculate their strength.
A rank correlation test is used to calculate the similarity of the orderings of the data when each data point is given a rank (i.e. a position of 1st, 2nd, 3rd for the Performance/Accessibility Score and the number of top 10 keywords per indexed page). If both of the observations for a given site have similar positions when ranked like this, we intuitively know that there is a strong rank correlation.
Kendall rank correlation tests also produce a Kendall Tau value of between 0 and 1 – a value of 0 indicates that there is no relationship between the variables, whilst a value of 1 indicates that there is a very strong relationship.
Kendall rank correlation test (performance score x organic visibility)
Kendall’s Tau = 0.052
P-value = 0.454 (>0.05)
Z-value = 0.253 (<1.96)
Kendall rank correlation test (accessibility score x organic visibility)
Kendall’s Tau = 0.128
P-value = 0.0638 (>0.05)
Z-value = 1.88 (<1.96)
When testing these correlations statistically using a Kendall rank correlation test, the relationship between Accessibility Score and organic visibility was far stronger, with Kendall’s Tau value of 0.128 compared to 0.052 for Performance Score.
To test whether these results are statistically significant, we need to look at the P- and Z-values. Performance produced a p-value of 0.454 (>0.05) and a z-value of 0.253 (<1.96) whilst Accessibility produced a p-value of 0.0638 (>0.05) and a z-value of 1.88 (<1.96).
In the case of Performance Scores, then, the test wasn’t statistically significant (with a p-value greater than 0.05). With Accessibility Scores, the test was likewise statistically insignificant because the p-value exceeded 0.05.
Descriptive image alt text
The use of descriptive image alt text on product page images was tested as part of this study. The vast majority of sites have implemented image alt text in some form, although there were a few examples of insufficient, one-word descriptions that were not deemed to be descriptive enough.
In total, 74 sites had descriptive image alt text whilst 26 did not. The average number of top 10 organic keywords per indexed page was 0.805 for those with descriptive image alt text and 0.460 for those without.
Two-Sample Z-Test
P-value = 0.180 (>0.05)
Z-value = 1.34 (<1.96)
The two-sample z-test here produced a p-value of 0.180 (>0.05) and a z-value of 1.34 (<1.96), so the test was statistically insignificant and we cannot reject the null hypothesis that sites with descriptive image alt texts have the same mean number of top 10 organic keywords as those without.
There is an 18% chance that the higher average organic visibility observed in sites with descriptive image alt text in this group would not apply to other fashion ecommerce sites. As such, the likelihood of this finding applying in the wider population is not particularly strong.
Hierarchical breadcrumbs
69 of the sites in this study had used hierarchical breadcrumbs whereas 31 had not. Those with hierarchical breadcrumbs had 0.799 top 10 organic keywords per indexed page on average whilst those without had 0.529.
Two-Sample Z-Test
P-value = 0.269 (>0.05)
Z-value = 1.106 (<1.96)
The p-value was 0.269 (>0.05) and the z-value was 1.106 (<1.96), so the test was not statistically significant and we cannot reject the null hypothesis that the mean number of top 10 organic keywords per indexed page is the same for sites with and without hierarchical breadcrumbs.
The probability of a type I error here is 26.9%, so the finding isn’t very likely to apply to other fashion ecommerce sites, albeit that those with hierarchical breadcrumbs had greater organic visibility within this group of 100 sites.
Checkout Ppges no-indexed or disallowed via robots.txt
41 sites had no-indexed or disallowed their checkout pages whilst 59 had not – the former group had 0.788 top 10 organic keywords per indexed page on average whilst the latter group had just 0.665.
Two-Sample Z-Test
P-value = 0.591 (>0.05)
Z-value = 0.537 (<1.96)
However, the p-value was 0.591 (>0.05) and the z-value was 0.537 (<1.96), so the test was not statistically significant and we cannot reject the null hypothesis that the no-index sites have the same number of top 10 keywords as those which hadn’t no-indexed checkout pages.
The chance that this finding would not apply to the wider population is 59.1%. Whilst the finding is correct in this context, it is unlikely to be true of other fashion ecommerce sites.


