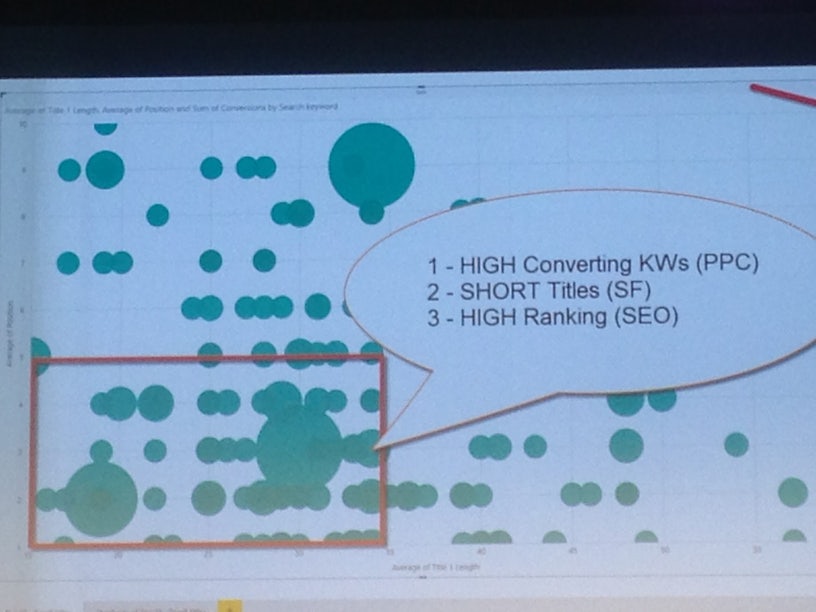
Wil opens his talk with the suggestion that we don’t do enough talking about money in SEO. We do in PPC – and that’s why they get our client’s money! It doesn’t matter how much we learn today, if none of it equates to ££££’s, it’s not worth anything.

He also believes that better integrated teams make better decisions. And that simplicity is the best way to get people to do things.
His three tips are:
- Talk about money
- Integrate it
- Be simple
Wildly Important Goals
Wil gave an example of asking himself what the most important thing he could work on would be. At the time, he was reading The 4 Disciplines of Execution by Sean Covey – which he recommends. Instead of asking what’s the most important thing you should work on, you should ask:
If every other area of our operation stayed at the current level of performance, what is the one area whee change would have the biggest impact?
For Wil, that provides instant focus.
He put together his WIG – Wildly Important Goals.
One was a team swap. He had his PPC and SEO people swap teams. That meant they were able to understand what the other teams were doing, and be able to integrate their tools and techniques.
Apparently, Wil doesn’t have quite as much sway in his business as he wants! Only one person in the company swapped teams. It annoyed him that he was able to be more strategic because he had more knowledge from the different teams, and loads of tools – but his team wasn’t doing it.
His vision, bottom line, was integration. So he thought fine, don’t swap teams, I’ll just create your strategies for you.
He uses Power BI, Domo, Tableau.
Evaluate the current state of keyword research
This is how we do it now:
- Talk to client
- Run keywords through tools
- Come up with a CTR curve (which, he says, is moronic – because people don’t search like that!)
- Prioritise then optimise
OK, so that’s how we used to do it. What Wil does is he takes 250,000 keywords with cost, position, conversions, snippets, real CTRs. He does this using Power BI.
What he can create is a graph which shows conversions, average positions and average search volumes and which can then identify the areas to focus on. It integrates SEO and PPC data.
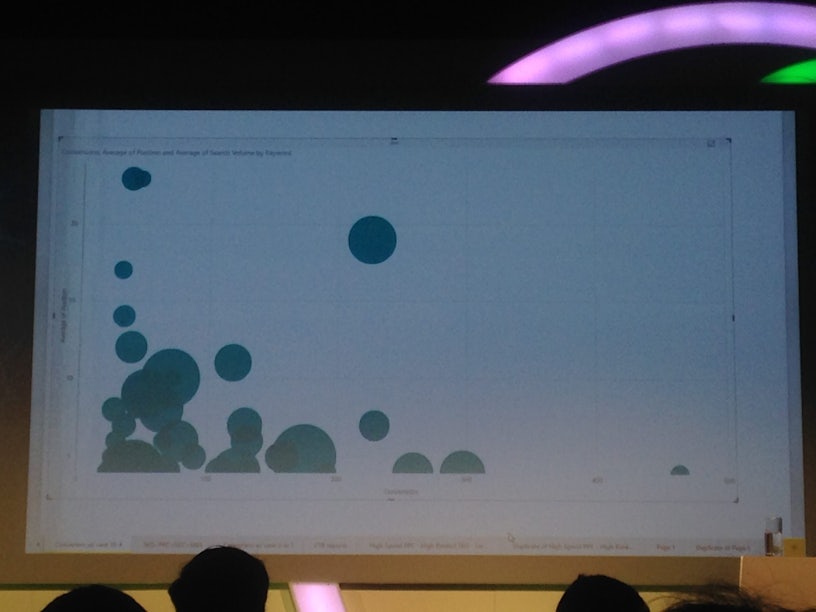
CTR curves are pointless. Why use generic ones when the information you need sits inside Google Search Console? You can create your client’s personal CTR curve with Power BI.
There aren’t any videos for Power BI for marketers.
Power BI doesn’t work on a Mac 🙁
1) Build your data warehouse
Go to google.adwords.com and put in all your data, then export.
Wil showed data from petdoors.com (who kindly allowed him to do so – thanks guys!). Go to Analytics, get the list of landing pages and export into your spreadsheet.
2) Clean up your data
Get your search queries from AdWords (not keywords, search queries) and the URL – you’ll need to clean them all up to be the same format. Just use find and replace to do this.
You can then integrate STAT data, SEMRush data, whatever other data sets you want.
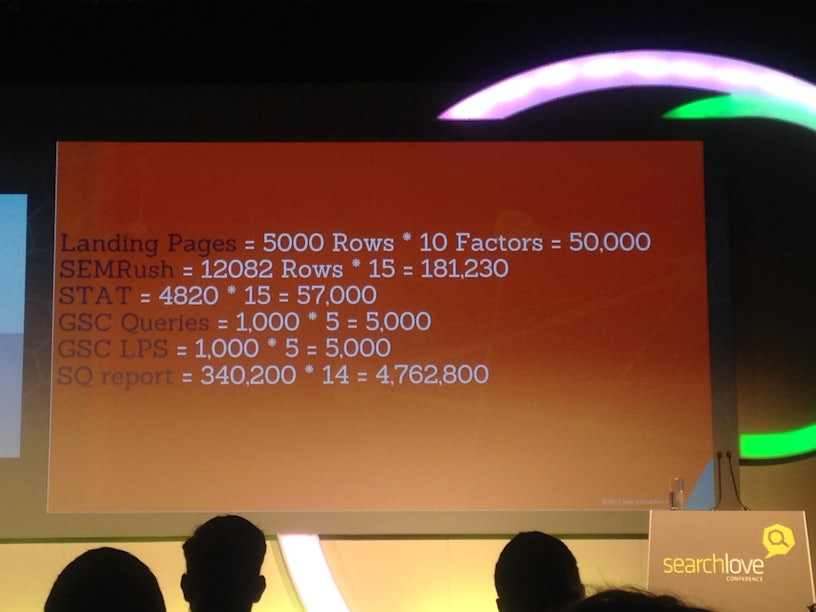
3) Organise your data
Use files and folders in Power BI. You can also use macros to automatically clean them up for you. You can also automate the updates and build a huge data centre.
4) Connect it all
Using Power BI, you can then create relationships between columns. Often, this results in errors when you try to marry the data together – so you have to cheat it.
Go to ‘edit queries’, look ay you two data sets that are likely to have two data sets with the same information in it twice. So order your data by ranking position, then remove the duplicate keywords.
You’ll need to be bidding on the keywords in PPC to be able to get the proper CTRs.
You can keep adding all sorts of stuff into this, any data set you like – even stuff like weather.
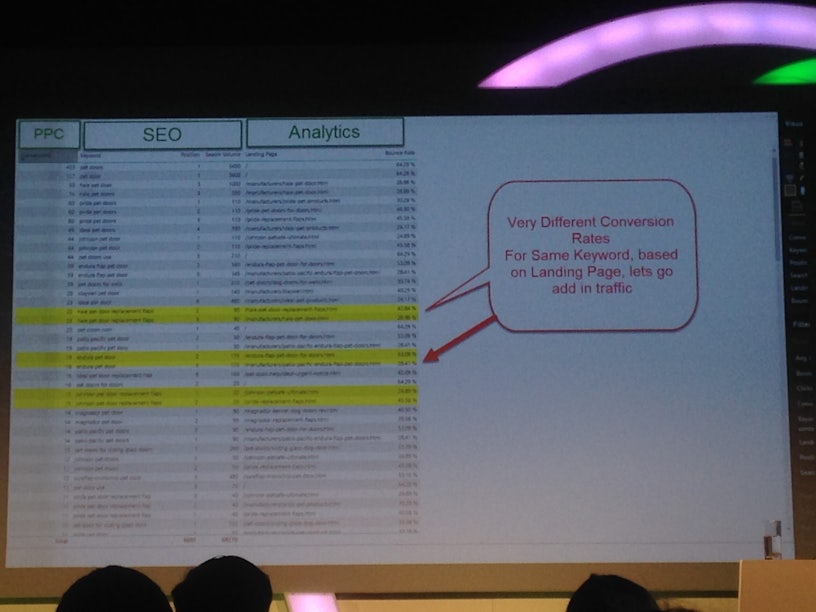
Be aware that Power BI will try to help you out by doing things like SUMMING your rankings – you don’t want that! Double check your source file.
5) Visualise your data
Power BI will automatically visualise your data as a ‘count’ – Wil recommends using averages instead. You can combine multiple reports, too.
Technical SEO and PPC
These go together too!
