
When we talk about the main differences between ‘digital PR’ and ‘traditional PR’ the common talking points usually refer to the processes of linkbuilding, campaign ideation and the varying metrics (think DR v AVE or referral traffic v ‘reach’) used to demonstrate the value of links and mentions to clients.
However, despite the many differences in how we approach campaigns to generate the type of coverage we want one thing remains universal: that the content we create is newsworthy.
I have seen many campaigns not realise their full potential simply because the content or asset they have created is simply not interesting or newsworthy to a broad spectrum of readers. It’s therefore crucial that the story or hook remains at front of mind right at the start of the ideation process, throughout any data analysis, and of course, when drafting that final press release.
Yes a piece of content telling me how much home insurance the family from Malcolm In The Middle would pay would have been interesting if I had watched the show and was thinking about purchasing home insurance but that’s a very small minority. Journalists have similar goals in mind to us as PRs; they want their stories to reach as many people as possible through social shares and ultimately traffic to their sites. As we need a reason to create links to our clients’ sites a journalist needs to create that trigger point where a reader has the inclination to click on their article and read more.
But back to the purpose of this blog…one of the best ways to establish what makes a great news hook is to consume as much media as possible. Read about what journalists are writing about, think about what is topical in today’s news agenda and establish how any of this news could be relevant or connected to your brand or client. Write down a list of example headlines and ask yourself which article you (or your Mum, Nan or your mate down the pub) would be most likely to click on.

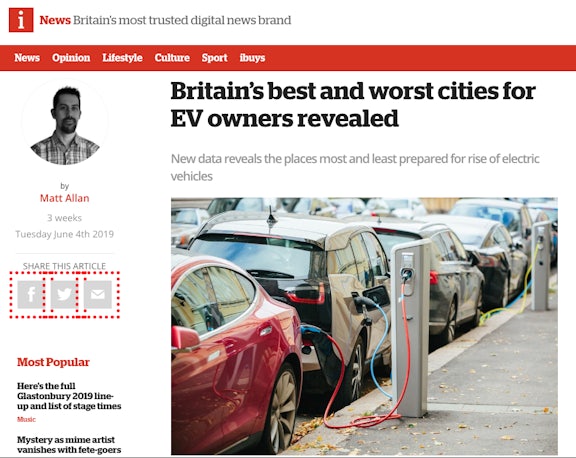
To give you an example of a couple of our recent ideation sessions, these led us to the dream headlines of “Why your hipster beard could be causing delays at UK airports” and “Which UK cities are most and least prepared for the rise of electric vehicles?“. The first one at least didn’t end up being the finished product but I’ll explain what happened with that one another time.
Once you have your dream story or headline in mind you need to think about how you’re going to prove your ‘hypothesis’ or claim and this doesn’t necessarily need to come from information or data from yourselves or the client. We live in a world where data is now so freely available through a quick Google search, FOI request or by simply reaching out to fellow PRs, industry experts, universities etc. The list goes on.
We’ll go back the latter example I mentioned earlier. We wanted to work out which UK cities were most and least prepared for the anticipated rise of electric vehicles and to do this we decided to look at charging points specifically. But how do we get the data? We obviously didn’t have the time or budget to commission our own research to count the total amount of charging points in various towns and cities across the UK….. However after speaking to the team over at Zap-Map we realised they had all the data we would need (to form part of our story anyway…).
Next we needed to know what the situation was in terms of where the charging points were most needed to prove how and why some cities were behind and ahead of the curve. With a quick Google search we stumbled upon a previous FOI request from the DVLA. We were then able to find out the total number of full driving license holders for each individual postcode area of the UK. With both of these data sets we could now use some quick maths to work out the total amount of license holders per charger for each location (as visualised below).

As you can see in the results the ‘most prepared’ cities where the ratio of license holders to charging points was highest included Sunderland, Milton Keynes and Dundee; some great news for their local areas and a strong positive story we could go after when we pull together our press releases – it turned out Sunderland City Council was ecstatic with the findings and they helped to push our news out even further! On the other hand it was clear Portsmouth, Shrewsbury and Derby had some catching up to do and we could also let their local areas of press know about this too.
We outreached the various versions of the press releases to national, regional and trade press and ended up securing 300+ links for our clients across a number of a number of high profile titles including I, Daily Express, MSN, The Scotsman and Yorkshire Evening Post. The campaign only took a few days to pull together demonstrating how using existing credible data can deliver maximum bang for buck when it comes to outreach. It’s less likely to be questioned by journalists meaning it’s more likely to be used.
There is an abundance of data out there in the public domain ready to be used for digital PR campaigns, the main challenge is just crafting the story (or hook) that you’re going to shout about. You should be able to explain your concept or idea to someone in a few words or ultimately to a journalist in a couple of short sentences during a pitch email so make sure this is evident right from the start. Combine your story with the best existing data and reap the rewards of your hard work when you begin your outreach.
Happy ideating!
TL;DR:
- Think of your newshook(s) and visualise what kinds of publications would realistically run that story before you begin anything
- Establish how you can prove your theory or claim in your headline
- Demonstrate as much clout as possible in your press release; reach out to industry experts for additional data, comments or to help steer your story if needed
- Ensure the final data and story is easy to understand is presented clearly and concisely: you should be able to explain your story in a couple of short sentences via email to a journalist
- Build your media lists to fit the various sectors outlined in the data – this could relate to the various industries, regions or age brackets mentioned
- If it doesn’t work first time revisit the data and look at alternative angles and stories
- Don’t be afraid of ‘re-outreaching’ a campaign a few months later if you feel it could fit with the constantly changing news agenda


