
Launched in 2014, Custom Columns allows you to create bespoke metrics and text results within the Google Ads interface. Updated in April 2022, the recent iteration of the Custom Column feature introduced:
- Spreadsheet functions / formulas
- Calculate and compare dynamic date ranges
- Use other custom columns in a custom column
- Ability to filter custom variables for conversions
- Non-metric columns supported within formulas
- New column data formats; “Date”, “Text”, “True/False”
- The ability to apply multiple filters to one formula
What does this mean for you? These updates introduce new possibilities which wouldn’t have been possible before, unless you used 3rd party software outside of the Google Ads platform via data exports and dashboards. With Custom Columns, you can:
- Glean fast, actionable insights
- Keep a closer eye on trends and changes within the market
- Increase efficiency with easier account management
You can now also compare metrics across different date ranges, allowing for dynamic formulas that reflect the report date you have selected. Previously, static date ranges would break if you hadn’t selected a specific report date range.
Here’s how you can start creating custom columns and a few useful examples that you can use in your account right now.
- How to create a custom column
- How to add the custom columns from this blog to your account
- 1. Campaign & group labelling
- 2. Identifying new keywords
- 3. Yesterday's percentage change in a metric
- 4. Increased competition
- 5. Increased competition (advanced)
- 6. Predicted spend
- 7. Average daily spend
- 8. Percentage of daily budget spent
- 9. Yesterday's conversions up/down
- 10. Conversion trends (last 7 days vs last 30 days)
- 11. Conversion breakdown (by action)
- 12. Percentage of spend on Search Partners
- 13. Metric on target (true/false)
- Tips for when creating Custom Columns
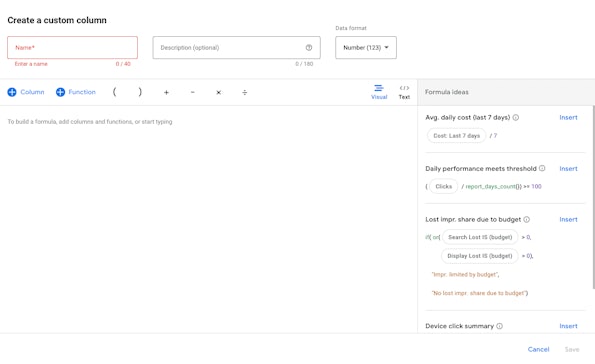
How to create a custom column
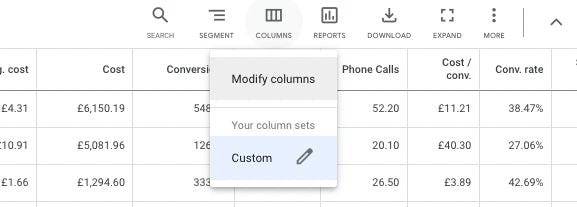
In the Google Ads Interface on the ‘campaign’ screen go to the menu on the right-hand side above the campaign table and click on;
- ‘columns’
- then ‘modify columns’
- scroll down to ‘Custom columns’
- click ‘+ Custom Columns’.
From here you can start to create your column.
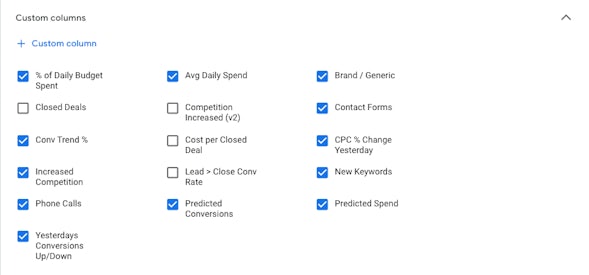
How to add the custom columns from this blog to your account
To add these custom columns to your Google Ads account you will need to follow the instructions above and then click on the ‘text’ view. In the text view, you will be able to copy and paste the formulas and then click save.
If you don’t select the text view you won’t be able to paste.
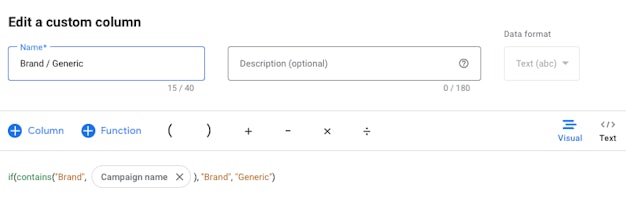
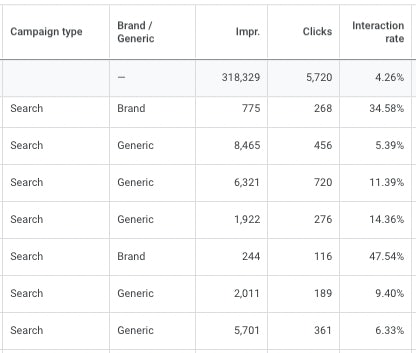
1. Campaign & group labelling
Data format: Text (ABC)
Level: Campaign / Ad Group / Keyword
Formula:
if(contains(“Brand”, Campaign_name), “Brand”, “Generic”)
This formula allows you to return a text result based on the campaign name or ad group name. This is useful when filtering or ordering your campaigns or ad groups. The below setup looks to return the text result ‘brand’ if the campaign name contains brand, if it doesn’t then it returns ‘generic’.
Ideas of other variations:
- Countries (eg, UK or US)
- Gender (Male or Female)
- High/Low-profit margin
- Product or Service Category
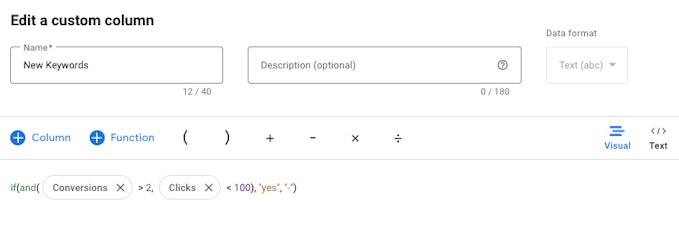
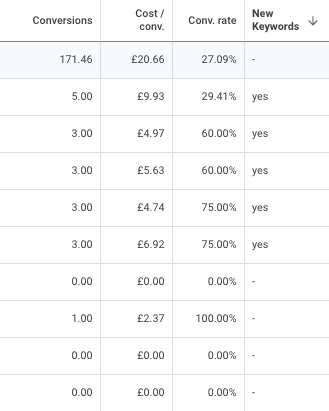
2. Identifying new keywords
Data Format: Text (ABC)
Level: Keyword
Formula:
if(and(Conversions >2, Clicks < 100), “yes”, “-“)
This column helps you identify new potential keywords based on the parameters you set. In the below set-up, the formula looks to see if a search term has had more than 2 conversions and less than 100 clicks. If it has then it returns “yes” and if it doesn’t then it returns “-”. You can then quickly filter your search query report to only show the terms returning “yes”, saving you time in your account.
Ideas of other variations:
- Campaign / Ad Group level: Conversions more than X and CPA below X
- Keyword level: Cost above X and Conversions less than X
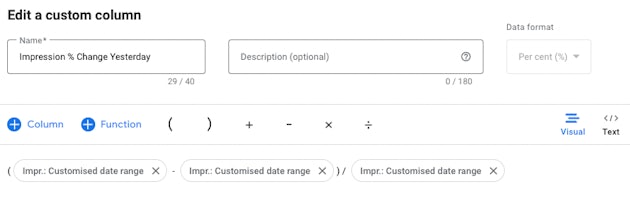
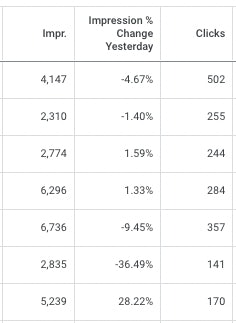
3. Yesterday’s percentage change in a metric
Data Format: Percentage (%)
Level: Campaign / Ad Group / Keyword
Formula:
(Impr.between_dates(yesterday, yesterday) – Impr.between_dates(yesterday.shift(0, 0, -1), yesterday.shift(0, 0, -1))) / Impr.between_dates(yesterday.shift(0, 0, -1), yesterday.shift(0, 0, -1))
This column provides you with the percentage change a metric had yesterday compared with the day before it. This is particularly useful for the ‘Impression’ metric as it allows you to spot trends in increasing or decreasing search volume and highlight changes within the market.
Ideas of other variations:
- Clicks
- Avg CPC
- Cost
- Conversions
- CPA
- ROAS (Conv Value / Cost)
- Week date range
- Month date range
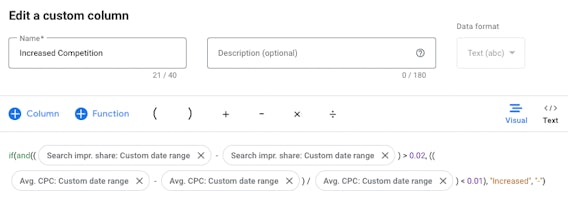
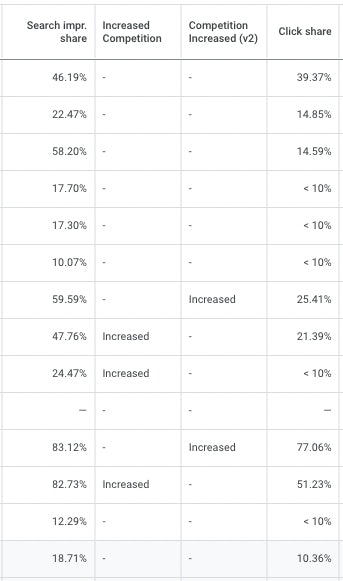
4. Increased competition
Data Format: Text (ABC)
Level: Campaign / Ad Group / Keyword
Formula:
if(and((Search_impr_share.between_dates(report_range_start, report_range_start) – Search_impr_share.between_dates(report_range_end, report_range_end)) > 0.02, ((Avg_CPC.between_dates(report_range_end, report_range_end) – Avg_CPC.between_dates(report_range_start, report_range_start)) / Avg_CPC.between_dates(report_range_start, report_range_start)) < 0.01), “Increased”, “-“)
This column takes into account decreases in Impression Share and increases in Average Cost-per-click (Avg. CPC) to identify if there has been an increase in competition in the market. If the statement is true then it will return “Increased”.
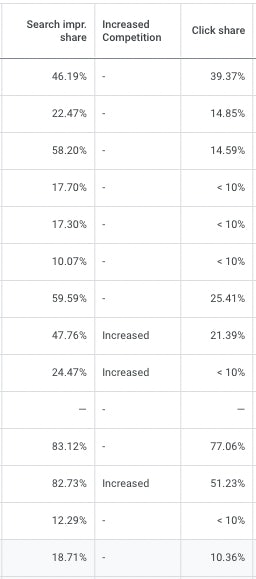
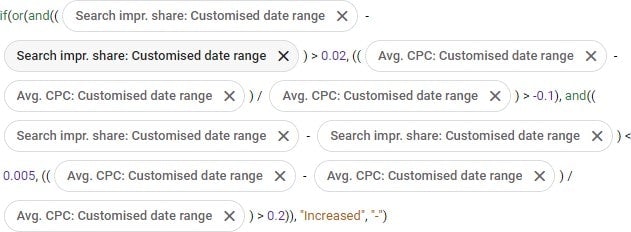
5. Increased competition (advanced)
Data Format: Text (ABC)
Level: Campaign / Ad Group / Keyword
Formula:
if(or(and((Search_impr_share.between_dates(report_range_start, report_range_start) – Search_impr_share.between_dates(report_range_end, report_range_end)) > 0.02, ((Avg_CPC.between_dates(report_range_end, report_range_end) – Avg_CPC.between_dates(report_range_start, report_range_start)) / Avg_CPC.between_dates(report_range_start, report_range_start)) > -0.1), and((Search_impr_share.between_dates(report_range_end, report_range_end) – Search_impr_share.between_dates(report_range_start, report_range_start)) < 0.005, ((Avg_CPC.between_dates(report_range_end, report_range_end) – Avg_CPC.between_dates(report_range_start, report_range_start)) / Avg_CPC.between_dates(report_range_start, report_range_start)) > 0.2)), “Increased”, “-“)
Building on the above formula, this column goes one step further and looks at if Impression Share has decreased or stayed level and Avg. CPC has increased OR if Impression Share has decreased and Avg. CPC has increased or stayed the same. If either statement is true then it will return “Increased”.
The market is never clear cut so this column allows for more variations and closer monitoring.
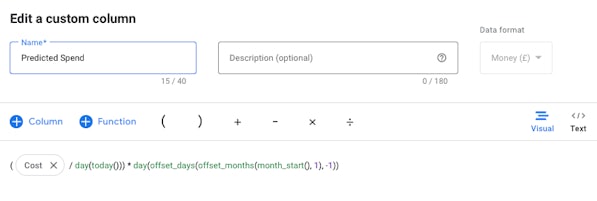
6. Predicted spend
Data Format: Money (£)
Level: Campaign / Ad Group / Keyword
Formula:
(Cost / day(today())) * day(offset_days(offset_months(month_start(), 1), -1))
This column is useful for judging pacing of monthly spends. It takes the current spend divided by the number of days past in the month, times the number of days left in the month.
Ideas of other variations:
- Impressions
- Clicks
- Conversions
- Individual Conversion actions
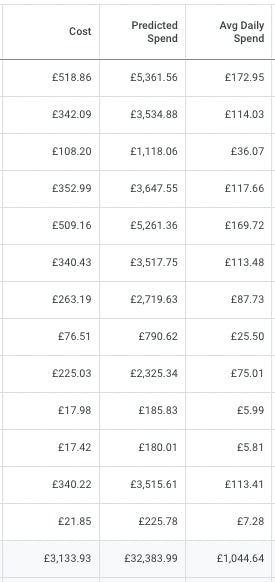
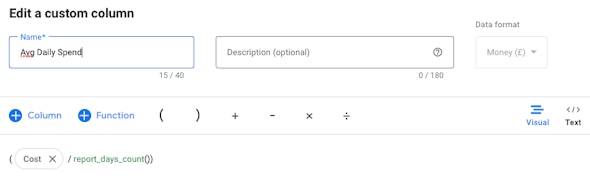
7. Average daily spend
Data Format: Money (£)
Level: Campaign / Ad Group / Keyword
Formula:
(Cost / report_days_count())
This column allows you to see what the average daily spend is per campaign / ad group / keyword. This allows you to keep a closer eye on where your budget is going. It divides the cost by the number of days selected in the reporting date range.
Ideas of other variations:
- Impressions
- Clicks
- Conversions
- Individual Conversion actions
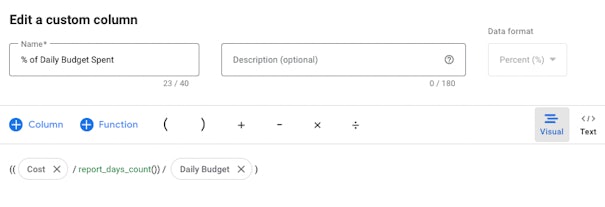
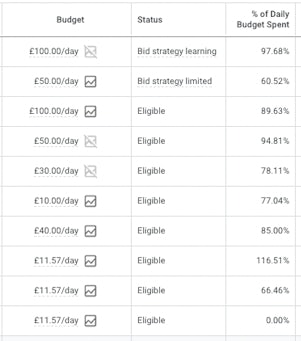
8. Percentage of daily budget spent
Data Format: Percentage (%)
Level: Campaign
Formula:
((Cost / report_days_count()) / Daily_Budget)
This column gives you insight into how much of your campaign level budget is being spent per day. This is great for identifying campaigns that are underspending or overspending which then allows you to adjust bid strategy targets or reallocate budgets to other campaigns to make sure you’re getting the most out of your overall account budget.
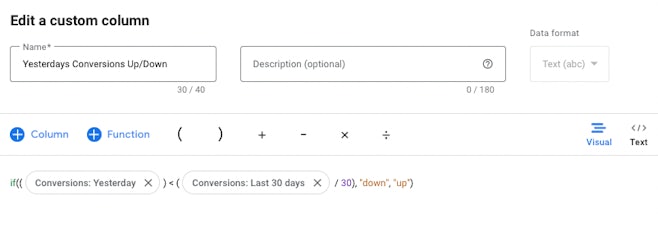
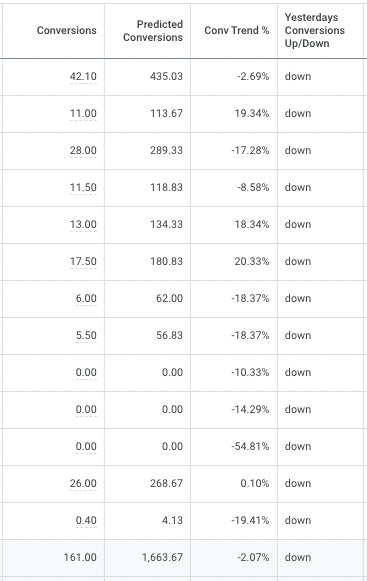
9. Yesterday’s conversions up/down
Data Format: Text (ABC)
Level: Campaign / Ad Group / Keyword
Formula:
if((Conversions.date_range(yesterday)) < (Conversions.date_range(last_30_days)/30), “down”, “up”)
This column looks at the number of Conversions yielded yesterday compared to the Last 30 days and tells you if yesterday’s performance was up or down in comparison. This is great for keeping an eye on how performance is going and can help you identify issues or opportunities if it’s the same results over the course of a few days.
Ideas of other variations:
- Impressions
- Clicks
- Cost
- Individual Conversion actions
- Last 7 days’ date range
- Last 14 days’ date range
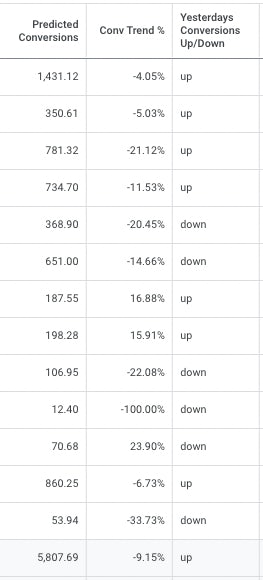
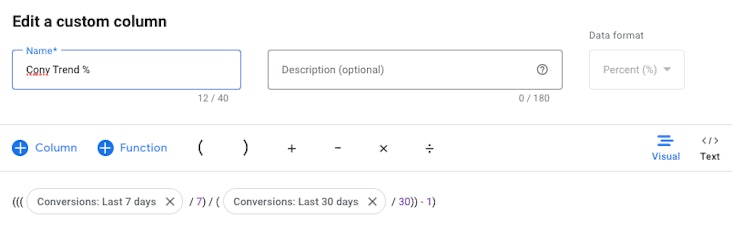
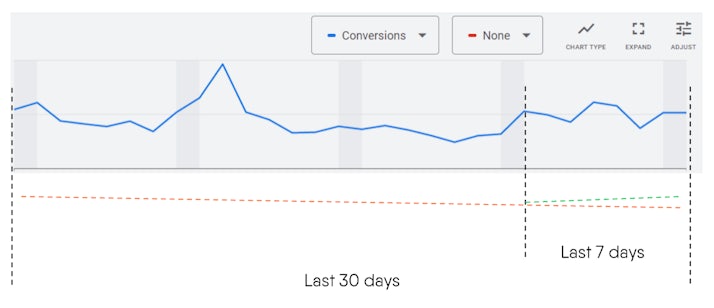
10. Conversion trends (last 7 days vs last 30 days)
Data Format: Percentage (%)
Level: Campaign / Ad Group / Keyword
Formula:
(((Conversions.date_range(last_7_days) / 7) / (Conversions.date_range(last_30_days) / 30)) – 1)
This column produces a percentage change in the last 7 days vs the last 30 days. This gives you the ability to see which direction a metric is trending and whether you need to take action to improve performance or capitalise on an opportunity.
Ideas of other variations:
- Impressions
- Clicks
- Cost
- Individual Conversion actions
- Last 7 days vs 14 days date range
- Last 14 days vs 30 days date range
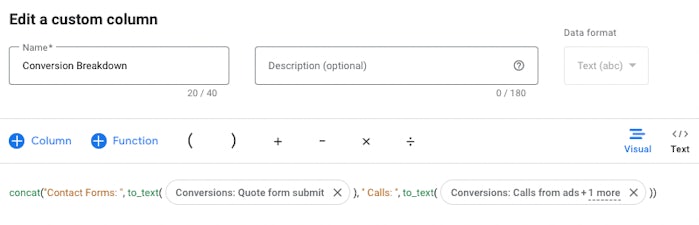
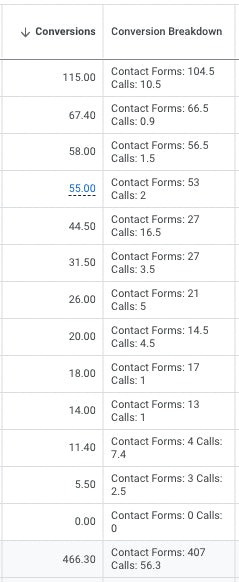
11. Conversion breakdown (by action)
Data Format: Text (ABC)
Level: Campaign / Ad Group / Keyword
Formula:
concat(“Contact Forms: “, to_text(Conversions.conversion_action(“Quote form submit”)), ” Calls: “, to_text(Conversions.conversion_action(“Calls from ads”, “Website calls from ads”)))
This column breaks down the number of conversions you’ve had from each conversion action. This allows you to see what your splits are between actions and spot any increases/decreases in volumes.
Ideas of other variations:
- All Conversions by Device type
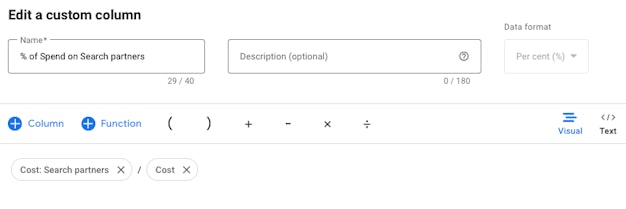
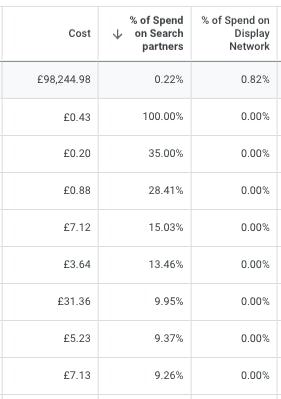
12. Percentage of spend on Search Partners
Data Format: Percentage (%)
Level: Campaign / Ad Group / Keyword
Formula:
Cost.network(partners) / Cost
This custom column gives you insight into how much of your budget is being spent on ‘Search Partners’ so that you can make an informed decision on whether to continue running search ads on them or not.
Ideas of other variations:
- Impressions
- Clicks
- Conversions
- Metric on Display Network
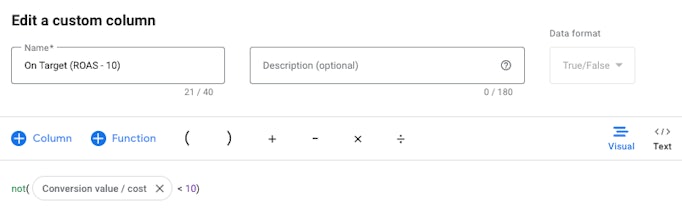
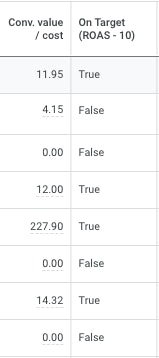
13. Metric on target (true/false)
Data Format: True / False
Level: Campaign / Ad Group / Keyword
Formula:
not(Conversion_value_per_cost < 10)
This custom column gives you insight into if a Campaign / Ad Group / Keywords is achieving your set account level KPI.
Ideas of other variations:
- Impressions
- Clicks
- Cost
- Conversions
- CPA
- Impression Share
- Click Share
These are just a handful of ideas and there are lots of different variations that can be made using these as bases to build from.
Tips for when creating Custom Columns
Custom Column Name
Keep this short as it will be shown at the top of the column in your campaign/ad group/keyword view so long titles will take up a lot of screen space meaning less room for your important new metrics and insights. We love acronyms in Digital Marketing so make sure you use them.
Custom Column Description
This is where you can put in as much detail as you want, there is nothing worse than creating a custom column for a specific need, only having to use it a couple of times but every time you have to open it back up to remember exactly what it calculates. The description only shows when you hover your mouse over the column title so there’s no need to worry about writing too much or even including the full formula in the description so you have a quick and easy reference.
Data Format
This may be the most important box to fill out correctly, if you select the wrong format and click save, that format is saved forever and can’t be changed. So if you get it wrong you’ll have to delete the columns and start again.
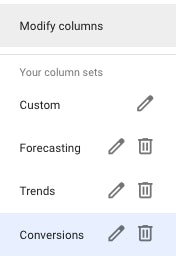
Column Sets
To save you from having hundreds of columns showing and having to scroll right for ages to find the column you’re looking for you can set up Column sets by theme so that you can have all your ‘trending’ columns together or all your ‘projection’ columns together.
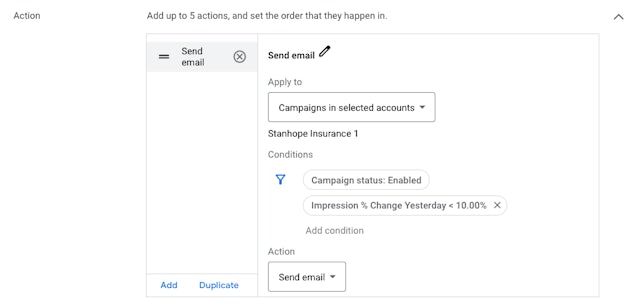
Set up Rules
You can set up rules to complete actions as a result of a value in your custom columns. For example that could be to send an email alert or increase/decrease budgets if competition increases.
We recognise and thank some of the professionals within the industry for creating some of these custom columns that have inspired this blog, such as Koos Hoeijmakers (Greenhouse).
For more tips and advice on how to get the most from your PPC performance and reporting, be sure to check out more in our blog. Explore our white papers, webinars and more in our resources.


